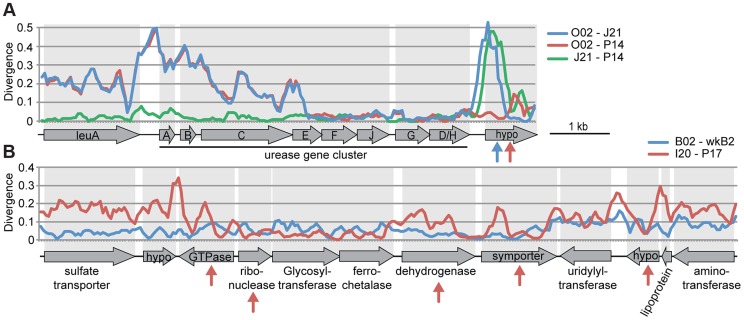
Figure 5. Recombination within genomic regions of (A) S. alvi and (B) G. apicola.
Sequence divergence at all sites is plotted for pairwise comparisons in a sliding window of 200 nucleotides with a step size of 50 nucleotides. Arrows indicate genes for which intragenic recombination between pairs has been detected with the program Geneconv. Arrow colors correspond to the different pairwise comparisons. (A) Sequence divergence over the urease gene cluster of S. alvi. Note the drastic decrease in sequence divergence between O02 and the other two SAGs in urease gene E. Recombination seems also to have occurred in the gene encoding a hypothetical protein (hypo) at the end of the gene cluster. (B) Sequence divergence over a genomic region of G. apicola. I20 and P17 show variation in sequence divergence, particularly in genes, for which intragenic recombination was detected. In contrast, no evidence for recombination could be found between B02 and wkB2.

