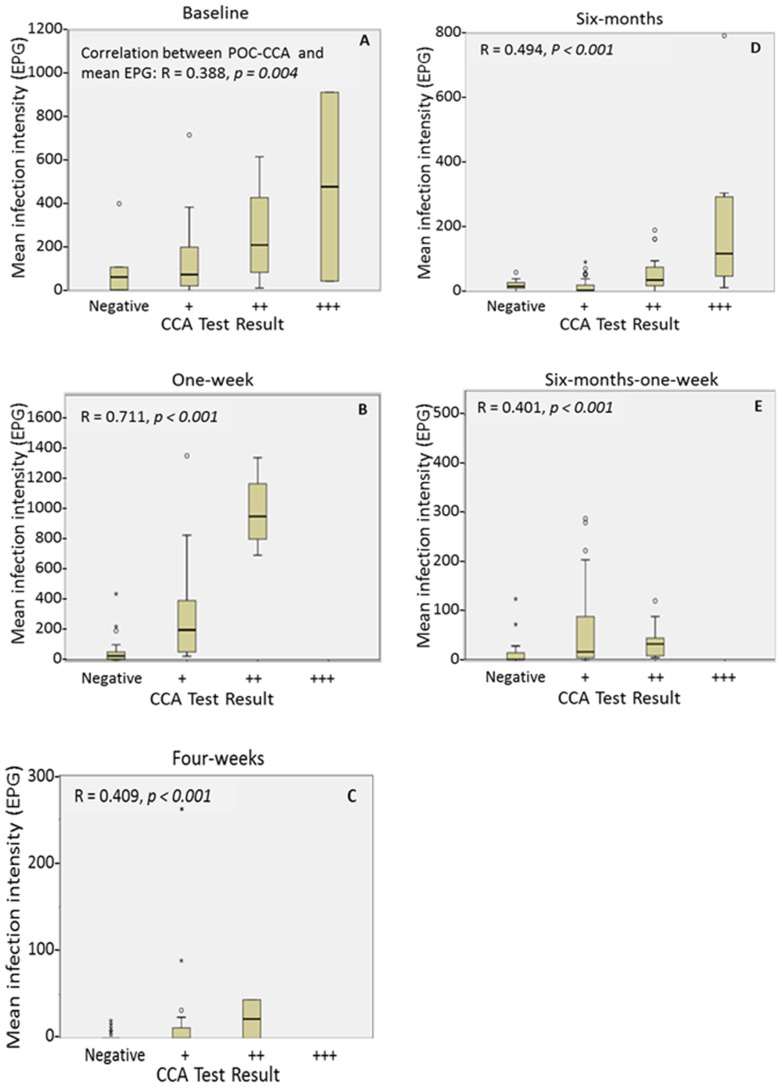
Figure 6. Comparison of S. mansoni arithmetic mean intensity measured by six Kato-Katzs with POC-CCA band strength.
S. mansoni mean intensity in eggs per gram of stool (EPG) in comparison to the band strengths of a single urine point-of-care circulating cathodic antigen test (CCA) at five time-points, from (A) pre-treatment at baseline, (B) one-week-post-, (C) four-weeks-post-, (D) six-months-post- and (E) six-months-one-week-post-praziquantel treatment. Spearman's rank coefficients and significance values are given for each time point. Trace readings were included in the + category. NB y axes vary.

