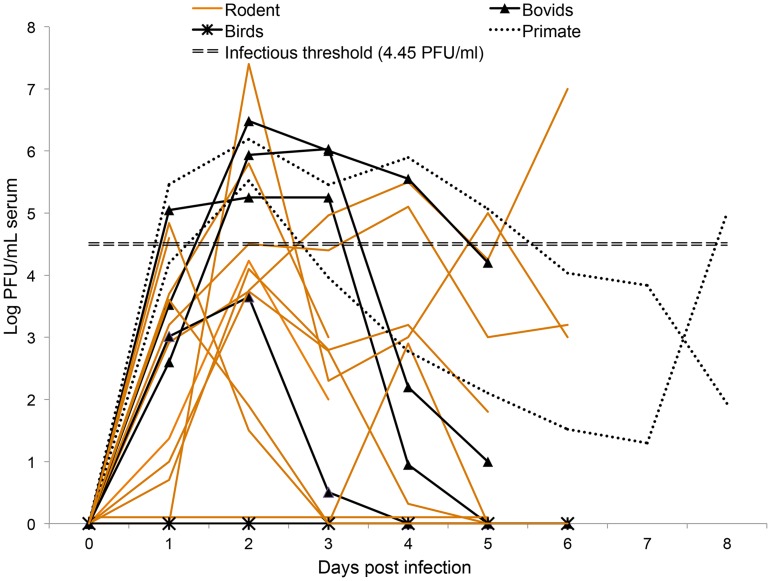
Figure 1. A graphical representation of the mean viremia profiles demonstrated by 20 different vertebrates after exposure to virulent strains of Rift Valley fever virus.
Data was compiled from 17 published experimental infection studies and unpublished data from Dr. John Morrill and Dr. Michael Turell. Viral titers were quantified each day after infection by Plaque Assay or Tissue Culture Infectious Dose 50, which was converted to PFU/ml by the following equation: PFU/ml = TCID50/ml×0.69 [39], [40]. When a vertebrate host's viremia was calculated to be negative the daily infectiousness was set to zero as discussed in the methodology. References: Bovids: [48]–[51]; Birds: [52] (Turell unpublished data); Primate: [53]–[55] (Morrill unpublished data); Rodent: [56]–[65].

