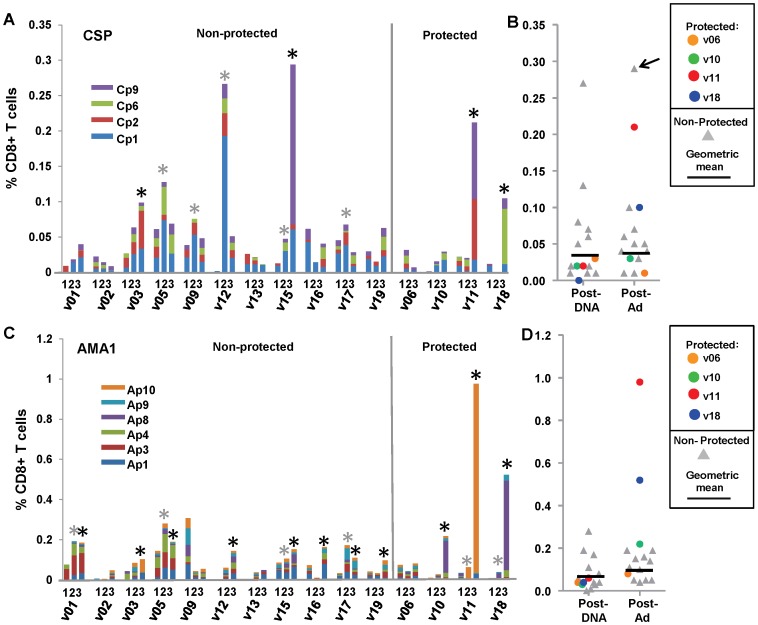
Figure 3. DNA/Ad CD8+ T cell IFN-γ activities to CSP and AMA1 peptide pools.
Panels A and C: CD8+ T cell IFN-γ activities of each volunteer to CSP or AMA1 peptide pools are shown as color coded stacked bars at pre-immunization (1), 28 days after DNA immunization (2) and 22/23 days after the Ad boost (3). *Positive activities (gray: post-DNA: black: post-Ad). Panels B and D: CD8+ T cell IFN-γ activities were summed and are shown as color-coded dots. Horizontal bars represent geometric mean activities of non-protected volunteers. The geometric means of summed activities of non-protected volunteers and the activities of each protected volunteer are shown in Table 1. Panel A: CSP: Five non-protected volunteers were positive after DNA immunization, but four volunteers were positive after Ad boost including protected v11 (0.21%) and v18 (0.10%) that were above non-protected volunteers, except v15 that had highest activity (0.29%), whereas protected v06 and v10 were negative. Most activity of v11, v18 and v15 was directed to single CSP peptide pools. Panel B: CSP: Geometric means of non-protected volunteers remained similar after DNA immunization and Ad boost when v11 and v18 were higher than all other volunteers, except v15 (arrow). Panel C: AMA1: Four non-protected volunteers were positive after DNA immunization, and 11 were positive after Ad boost, including protected v10 (0.22%), v11 (0.98%) and v18 (0.52%) that were above non-protected volunteers, whereas protected v06 negative. Most activity of v10, v11 and v18 was directed to single AMA1 peptide pools. Panel D: AMA1: Geometric means of non-protected volunteers rose after Ad boost compared to after DNA immunization, and v10, v11 and v18 higher than all volunteers.

