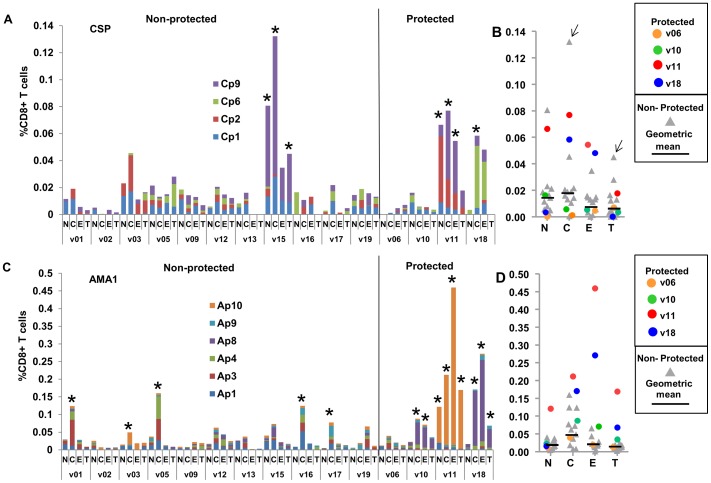
Figure 4. DNA/Ad CD8+ T cell memory IFN-γ activities to CSP and AMA1 peptide pools.
Panels A and C: CD8+ T cell IFN-γ activities of each volunteer to CSP or AMA1 peptide pools 22/23 days after the Ad boost are shown as color coded stacked bars, differentiating memory naïve (N), central (C), effector (E) and terminally differentiated (T) cells (per cent of CD8+ T cells) to CSP and AMA1 peptides as color-coded bars. Non-protected and protected volunteers are grouped. *Positive activities (defined in Methods). Panels B and D: CD8+ T cell IFN-γ memory activities were summed and are shown as color-coded dots. Horizontal bars represent geometric mean activities of non-protected volunteers. The geometric means of summed activities of non-protected volunteers and the activities of each protected volunteer are shown in Table 1. Panel A: CSP: among non-protected volunteers, only one (v15) had positive CM and TD activities and none had positive EM activities. One protected volunteer (v11) had positive CM, EM and TD activities whereas protected v18 had only positive CM activity. Positive CM, EM and TD activities were predominantly directed to single CSP peptide pools. Panel B: the geometric mean of CM and EM activities of non-protected volunteers were lower than protected v11 and v18, except CM activity of non-protected v15 (arrow). Panel C: AMA1: five non-protected volunteers only had positive CM activities, whereas protected v10 had positive CM and EM, and v11 and v18 had positive CM, EM and TD activities that were mostly directed to single AMA1 peptide pools. Panel D: AMA1: the geometric mean of CM activities of non-protected volunteers was similar to v10 but lower than v11 and v18; however, protected v10, v11 and v18 were above the geometric means of EM and TD activities of non-protected volunteers.

