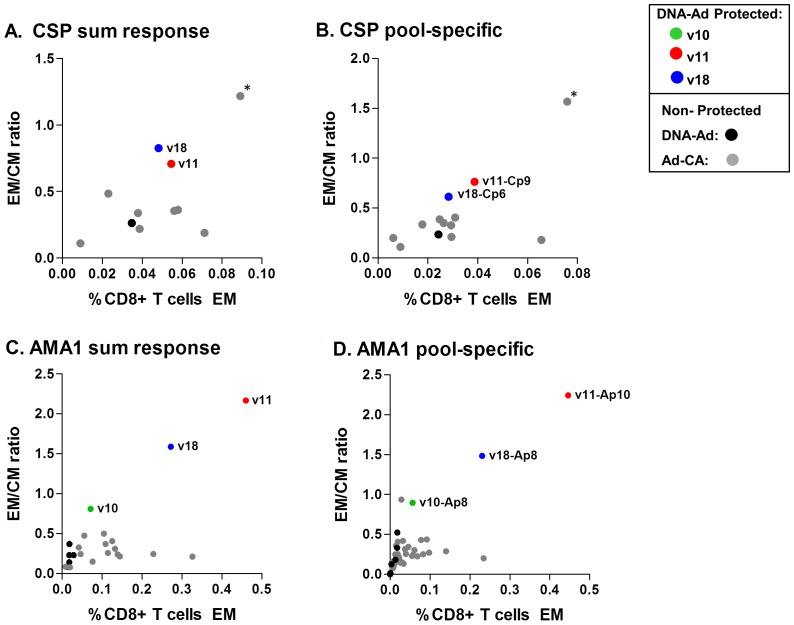
Figure 6. Ratios of effector to central memory in DNA/Ad and AdCA trials for CSP and AMA1 (based on summed and pool-specific responses).
All volunteers who had positive summed and pool-specific CD8+ IFN-γ memory central (CM) and effector (EM) activities after Ad boost for CSP or AMA1 were plotted as the ratio of EM:CM vs. EM activity. In addition, some volunteers who had positive CM but negative EM activities were included. Volunteers with negative CM and EM activities were not included. Panel A. CSP summed response: protected v11 and v18 had a higher EM:CM ratio than all other volunteers in the DNA/Ad and AdCA trials, except v135 in the AdCA trial (*). EM activity of v18 did not meet the positivity definition. Panel B. CSP pool-specific response: protected v11 and v18 had a higher EM:CM ratios against Cp9 (v11) and Cp6 (v18) respectively than all other volunteers with positive EM and/or CM activities against any individual pools in the DNA/Ad and AdCA trials, except v135 in the AdCA trial. EM activity of v18 did not meet the positivity definition. Panel C. AMA1 summed response: protected v10, v11, and v18 had a higher EM:CM ratio than all other volunteers with positive EM and/or CM activities in the DNA/Ad and AdCA trials. Panel D. AMA1 pool specific response: protected v10, v11 and v18 had a higher EM:CM ratios against Ap8 (v10 and v18) and Ap10 (v11) compared to all other volunteers in the DNA/Ad and AdCA trials.

