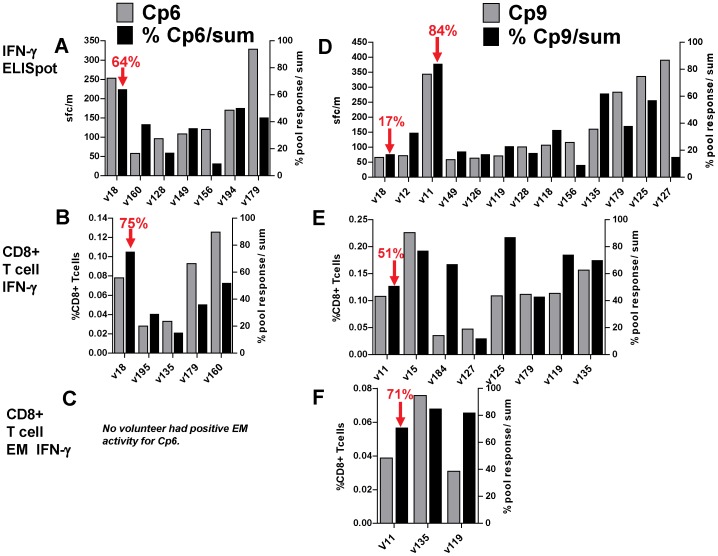
Figure 7. DNA/Ad and AdCA: Comparison of positive T cell activities and percent of total activities to CSP peptide pools.
ELISpot, CD8+ T cell IFN-γ, and CD8+ T cell EM IFN-γ activities to individual CSP peptide pools (Cp6 and Cp9) were calculated as per cent of total activities of summed responses to all CSP peptide pools. All volunteers positive with Cp6 or Cp9 were selected. Panels A, B, C: Cp6: protected v18 had lower activities than some AdCA volunteers, but highest per cent activities; v194 (delay to patency) had higher per cent ELISpot activity than other AdCA volunteers, but lower than v18. None of the DNA/Ad or AdCA volunteers had positive EM activity to Cp6. Panels D, E, F: Cp9: protected v11 had highest per cent ELISpot activity to Cp9, but CD8+ T cell IFN-γ and EM activities were lower than some AdCA volunteers.

