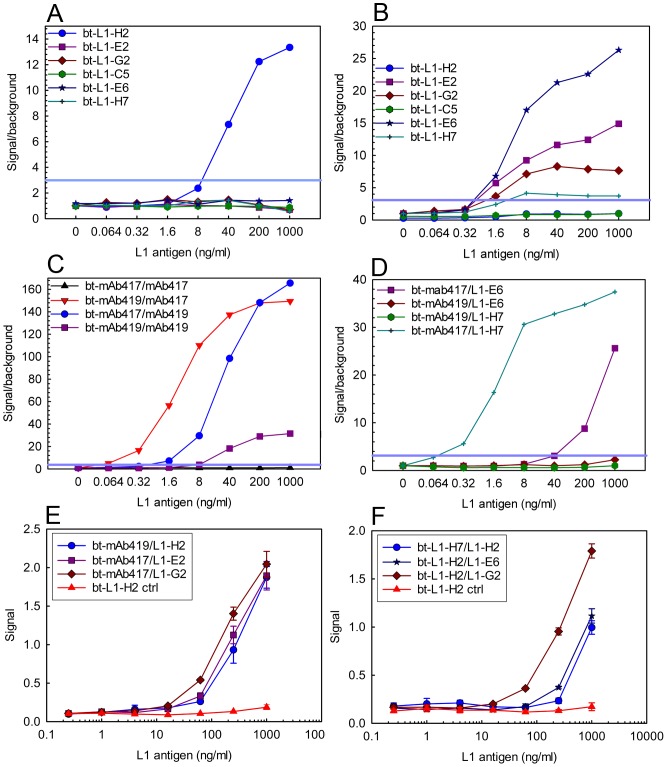
Figure 2. Sandwich immunoassay for L1 detection.
These assays were performed on at least two different days; representative binding assays are shown. Panels A-D are MAGPIX assays and are plotted as signal over background versus the L1 concentration; a signal over background of 3 was set as the limit of detection and is indicated by a blue line. Each MAGPIX assays measures binding from at least 50 beads and the error of the mean fluorescence intensity is within 5%. Panel A, mAb419 capture with the biotinylated (bt)-sdAb tracers. Panel B, mAb417 capture with the bt-sdAb tracers. Panel C shows combinations of the mAb capture and tracer pairs. Panel D shows the sdAb L1-E6 and L1-H7 captures paired with the mAb reporters. Panels E and F are ELISA data, each point represents the average of three measurements and the error bars represent the standard deviation. Control lines were collected with the bt-L1-H2 tracer in combination with a non-L1 binding capture sdAb. Panel E shows sdAb capture and mAb reporters. Panel F shows sdAb capture and tracer pairs.

