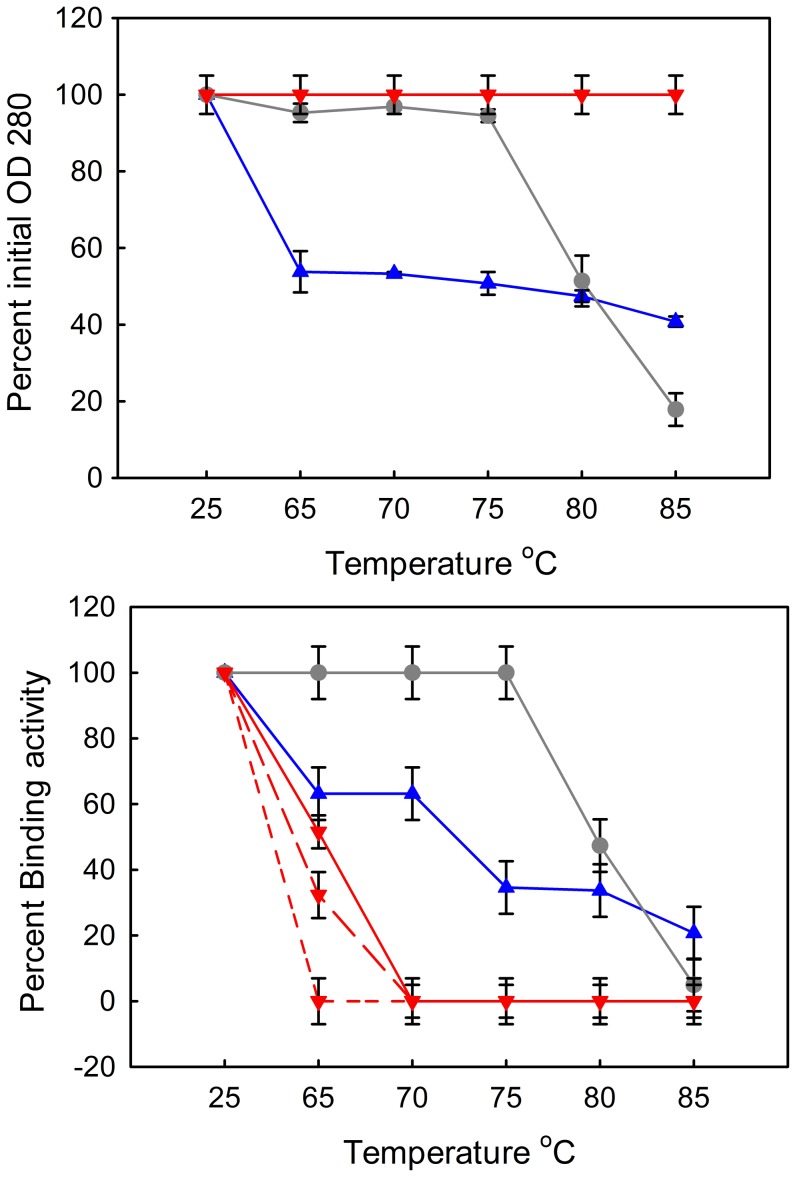
Figure 4. Thermal stability assay.
Following a one hour incubation at the defined temperature optical density at 280 nm was measured to assess protein aggregation (upper panel). Samples G2 (blue triangles) and G2+ (gray circles) were measured in duplicate, and showed the same solubility behavior in each replicate. Since all of the mAbs behaved similarly they are all represented by the same symbol (red upside-down triangle). Binding activity following incubation was measured using a direct binding assay with the L1 antigen directly immobilized to four rows of a sensor chip for SPR analysis (lower panel). The mAbs have the same color and symbol but are differentiated by line type: mAb419 with short dashes, mAb418 with long dashes, and mAb417 with a solid line.

