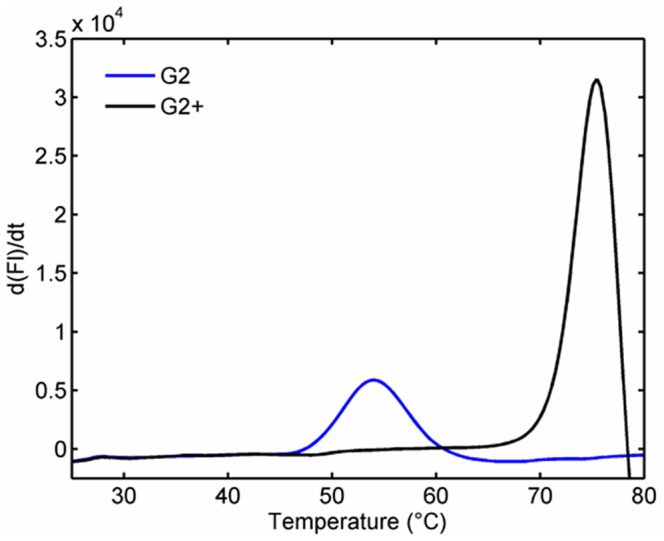
Figure 5. Increased melting temperature of L1-G2+.

Fluorescence based melting assay showing melting of L1-G2 in blue and the mutant with the added disulfide, L1-G2+, in black. Melting temperature is determined from a plot of the first derivative of the melt curve. The measurements were performed in triplicate on two different days and showed identical results; for clarity only one replicate is shown.
