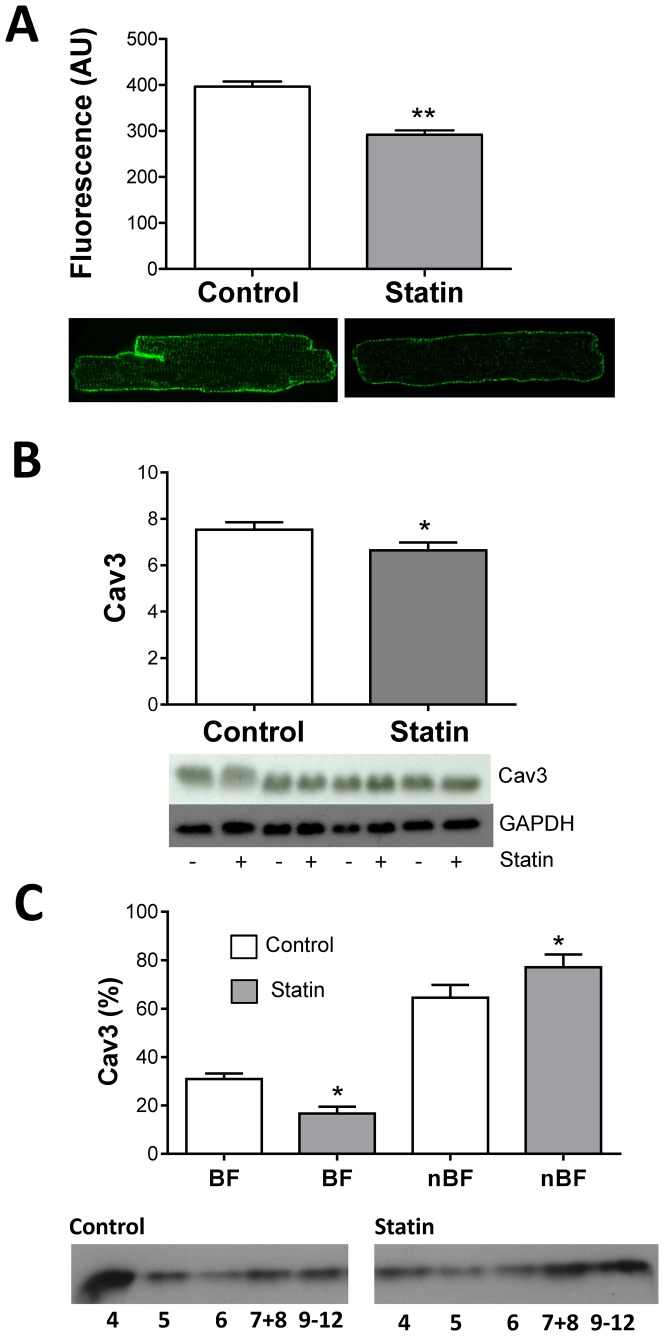
Figure 2. Simvastatin treatment reduces cellular and caveolar Cav3.
A. Total membrane-bound Cav3 indexed using immunocytochemistry. Bar graph shows mean fluorescence (arbitrary units, AU) from 59–70 myocytes. Representative control and statin-treated myocytes are shown below. B. Total cellular Cav3 measured in cell lysates using Western blotting. Values are normalised to GAPDH. C. Membrane distribution of Cav3 measured in cell lysates following sucrose density gradient fractionation using Western blotting. Fractions 4 and 5 are cholesterol-enriched buoyant fractions (BF); fractions 7–12 are non-buoyant fractions (nBF). All data are mean + S.E.M from n = 3–4 hearts. * P<0.05, ** P<0.01 vs. control, Student's t-test.

