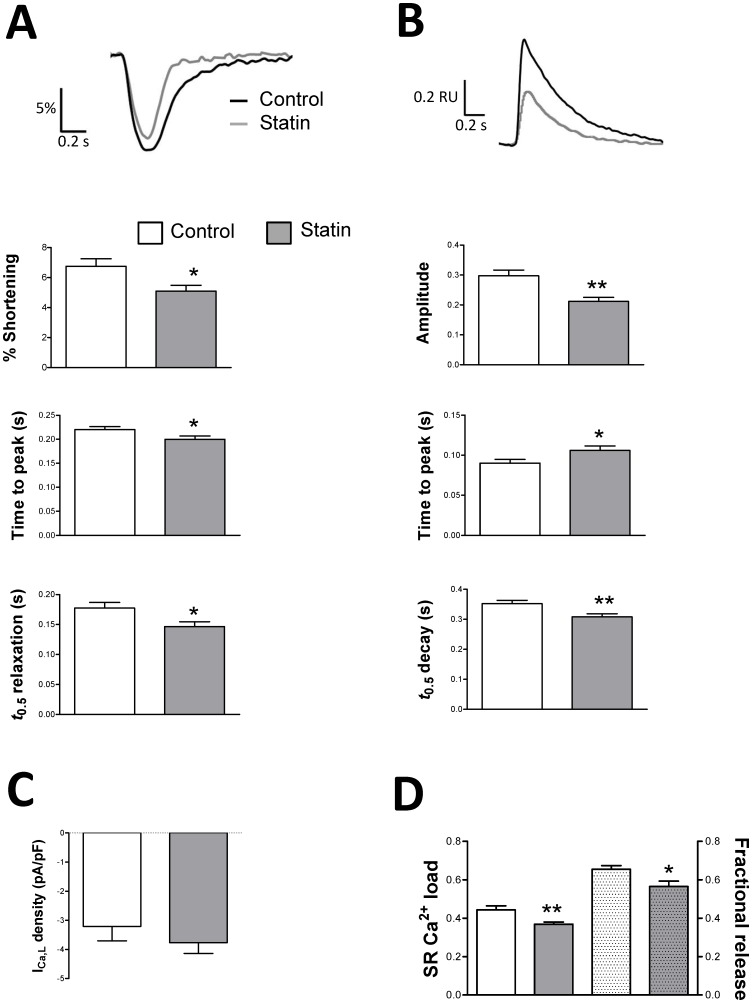
Figure 4. The effect of simvastatin treatment on shortening, [Ca2+]i handling and I Ca,L under basal conditions.
A. Representative traces and mean data of amplitude and kinetics of shortening. Shortening amplitude is expressed as a % of resting cell length. There was no difference in resting cell length between groups (97±2 vs. 101±3 µm in control and statin-treated cells respectively). n = 33–41 myocytes from 5 hearts. B. Representative traces and mean data of amplitude and kinetics of the [Ca2+]i transient. Transient amplitude is expressed in fura-2 ratio units (RU). There was no difference in diastolic [Ca2+]i between groups (0.78±0.01 vs. 0.80±0.01 RU in control and statin-treated cells respectively). n = 33–41 cells from 5 hearts. C. Peak ICa,L was measured following a step from −40 to 0 mV. n = 6–8 cells from 3 hearts. D. Sarcoplasmic reticulum (SR) Ca2+ load and fractional SR Ca2+ release. The left side of the panel shows the amplitude of [Ca2+]i transients (expressed as RU) induced by rapid application of 10 mM caffeine, an index of SR Ca2+ load. On the right, fractional release (the amplitude of the steady-state electrically-stimulated transient/caffeine-induced transient) is shown. n = 33–36 cells from 4 hearts. * P<0.05; ** P<0.01, Student's t-test.

