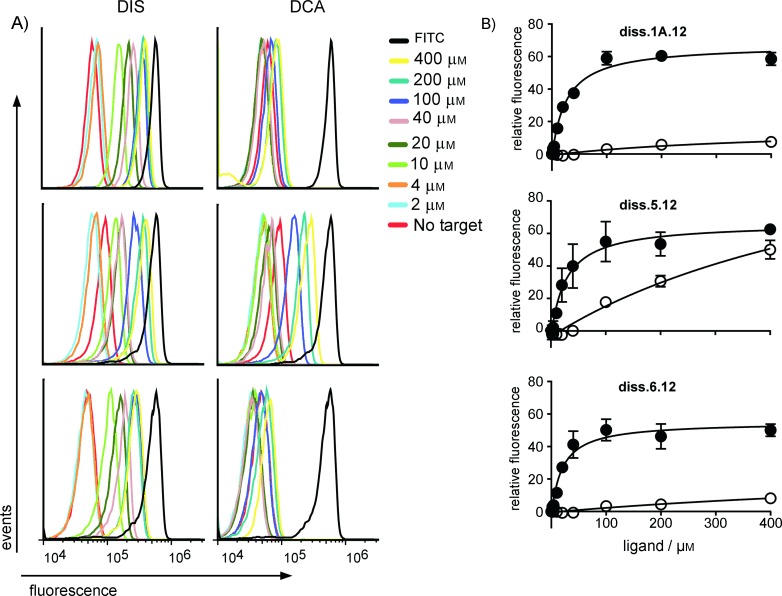
Figure 4.

Binding activity of sequences isolated from the LN12 selection. A) Representative flow cytometry histograms of bead-bound aptamer beacon devices incubated in the presence of increasing concentrations of DIS (left) or DCA (right); note scale. All experiments contained a sample reaction performed in the absence of target or bearing only the FITC-labeled oligonucleotide, representing the signal expected from a construct which had fully turned “ON′′. B) Binding curves were determined (n=3, SE shown) from the histograms by plotting the mode of relative fluorescence of singlet bead populations in the presence of DIS (•) or DCA (○). The apparent binding constants for diss. 1 A.12, diss. 5.12, and diss. 6.12 for DIS were 26.2±4.1, 27.1±11.4, and 19.4±6.3 μm, respectively. Due to poor binding, the apparent binding constants for DCA could not be determined accurately.
