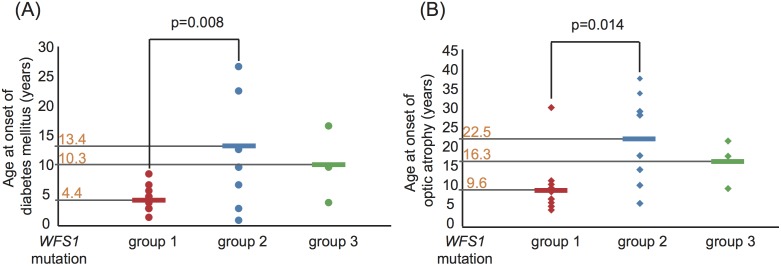
Figure 2. Analysis of genotype-phenotype correlations for WFS1 mutations.

Ages at onset of both diabetes mellitus (A) and optic atrophy (B) in each patient in the three groups are shown graphically with the mean age indicated on the vertical axis. Patients are color-coated according to the mutation categories: group 1 (n = 15) in red, group 2 (n = 9) in blue and group 3 (n = 3) in green. The differences between group 1 and group 2 were statistically significant: diabetes mellitus 4.4±1.9 years vs. 13.4±9.9 years, p = 0.008, and optic atrophy 9.6±6.9 years vs. 22.5±12.4 years, p = 0.014, respectively. Data are expressed as means ± SD.
