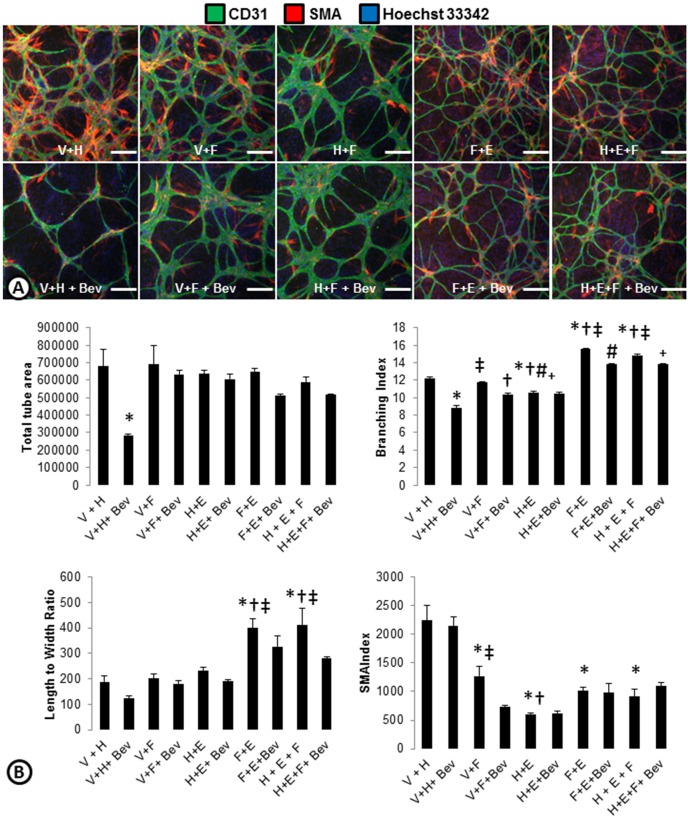
Figure 4. Phenotypes of angiogenic growth factor combinations.
(A) ADSC and ECFC co-cultures were treated with combinations of angiogenic growth factors (V = VEGF, H = HGF, F = bFGF, E = EGF) with or without anti-VEGF (Bevacizumab; Bev) and stained for cords (CD31; green), smooth muscle actin (SMA; red), and nuclei (Hoechst 33342; blue). (B) ArrayScan quantifications of total tube area, branching index, length to width ratio, and SMA index of samples treated with combinations of growth factors with and without bevacizumab. n = 3 per group. * = p<0.05 vs. V+H. † = p<0.05 vs. V+F. ‡ = p<0.05 vs. H+E. # = p<0.05 vs. F+E. + = p<0.05 vs. H+E+F. Scale bars are 250 µm.

