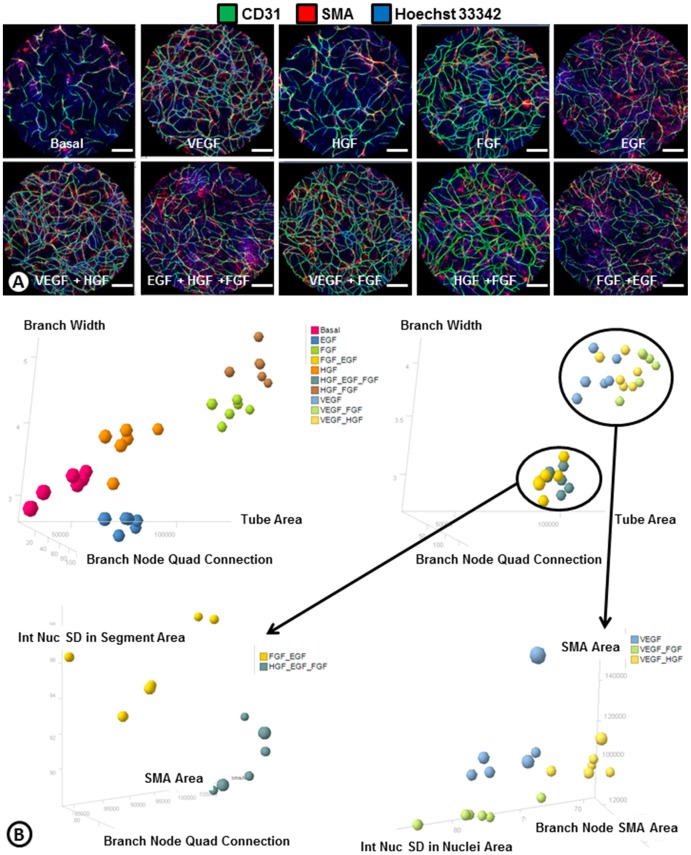
Figure 5. Cluster analysis of phenotypes associated with angiogenic growth factors.
(A) Whole-well Acumen images of ADSC and ECFC co-cultures treated with angiogenic growth factors or combinations of growth factors following a heparin wash and stained for cords (endothelial cells; CD31; green), smooth muscle actin (SMA; red), and nuclei (Hoechst 33342; blue). (B) Cluster analysis based on the top phenotypes from the 101 ImageJ descriptors (Table S1) differentiate the phenotypes of cords driven by angiogenic growth factors or growth factor combinations. The output from statistics comparing the same populations in terms of all the dimensions is shown in Table S2. A p-value less than 0.05 indicate the means of the two groups were significantly different in at least one dimension. Scale bars are 1000 um.

