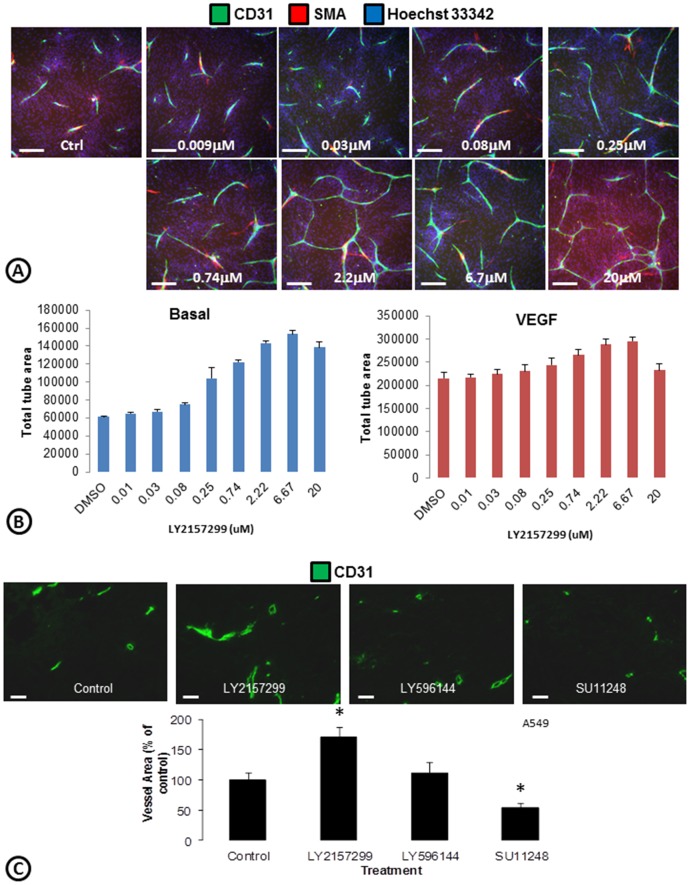
Figure 7. Induction of cord formation with a TGF-β inhibitor.
(A) Co-cultures of ADSCs and ECFCs were treated with a TGF-β inhibitor (LY2157299) and stained for cords (CD31; green), smooth muscle actin (SMA; red), and nuclei (Hoechst 33342; blue). (B) ArrayScan quantifications of total tube area following treatment with LY2157299 in basal medium (left) versus VEGF driven cords (right). n = 6 per group. (C) Mice harboring A549 tumor xenografts were treated with a TGF-β inhibitor (LY2157299), an inactive control (LY596144), or sunitinib (Sutent; SU11248) for 5 days. Tumors were fixed, sectioned, stained for tumor vessels (CD31; green), and quantified using Image J. * = p<0.05 vs. control. n = 4–6 per treatment group. Scale bars in A are 250 µm. Scale bars in B are 50 µm.

