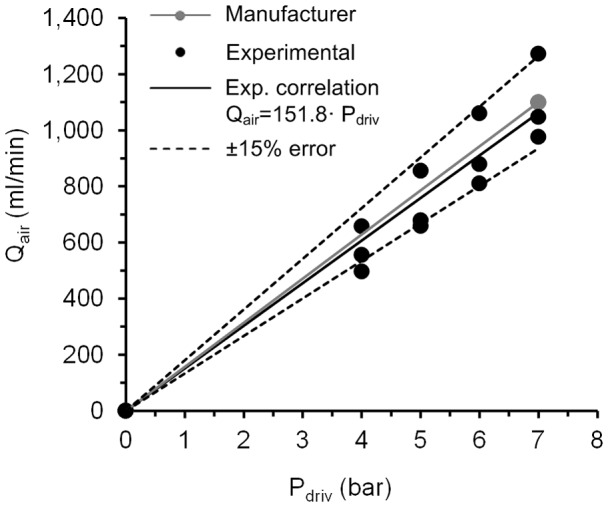
Figure 5. Air flow rate as a function of the driving pressure for three ICs.

Comparison between experimental values of air flow rate that fit with a linear correlation and the values of the manufacturer; ±15% error obtained with respect to the data from the manufacturer. Qair: air flow rate. Pdriv: driving pressure.
