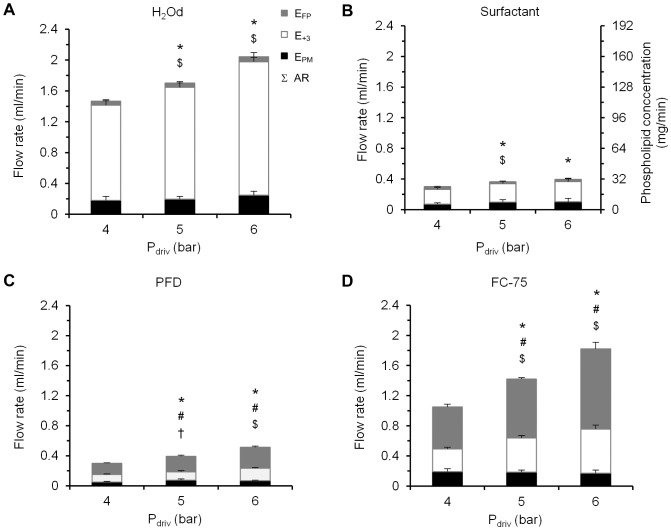
Figure 9. Deposition results as function of the compound and the driving pressure.
A, Deposition results for H2Od; B, Surfactant; C, Perfluorodecalin, PFD; D, FC-75. Right vertical axis values on B are the phospholipid quantity (mg) corresponding to each rate on the left axis. EFP: mass flow rate of fine particles. E+3: mass flow rate that exits from the model. EPM: mass flow rate for the compound deposited within the model. AR: aerosolization rate. Σ: total height of each column. Pdriv: driving pressure. Values are given as mean ± SD. * is for AR vs. previous pressure; # is for EFP vs. previous pressure; $ is for E+3 vs. previous pressure; and † is for EPM vs. previous pressure. p<0.05, One-factor ANOVA.

