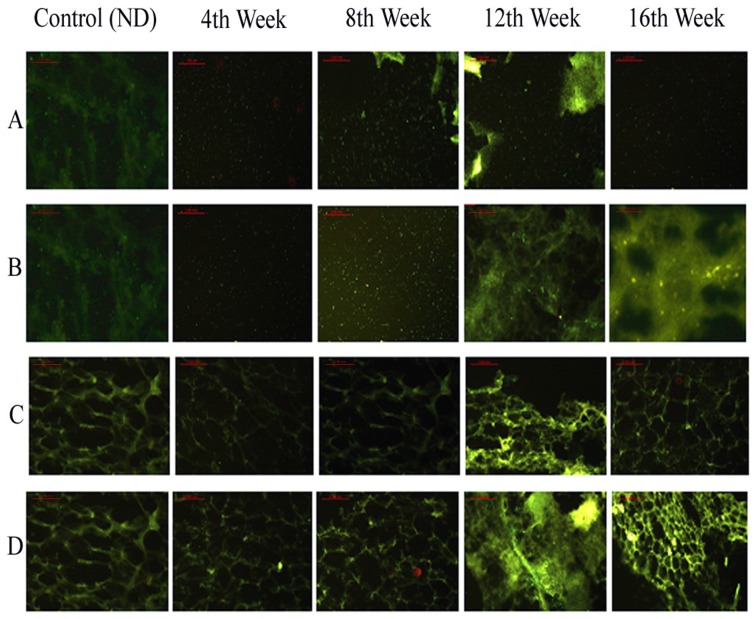
Figure 4. Effects of pioglitazone on expression distribution of CIDEC and PPAR-γ on VAT.
Fat cells were collected at 4, 8, 12 and 16 weeks and immunofluorescence staining was used to analyze expression of CIDEC and PPAR-γ. Row A and C show expressions of PPAR-γ and CIDEC in mice fed on normal diet (ND) and 4, 8, 12 and 16 weeks of high fat diet (HFD) group. Row B and D represent effects of pioglitazone on the expressions of PPAR-γ and CIDEC in ND group, and 4, 8, 12 and 16 weeks of HFD group. Fluorescence microscope was used to observe the expressions and distribution of PPAR-γ and CIDEC.

