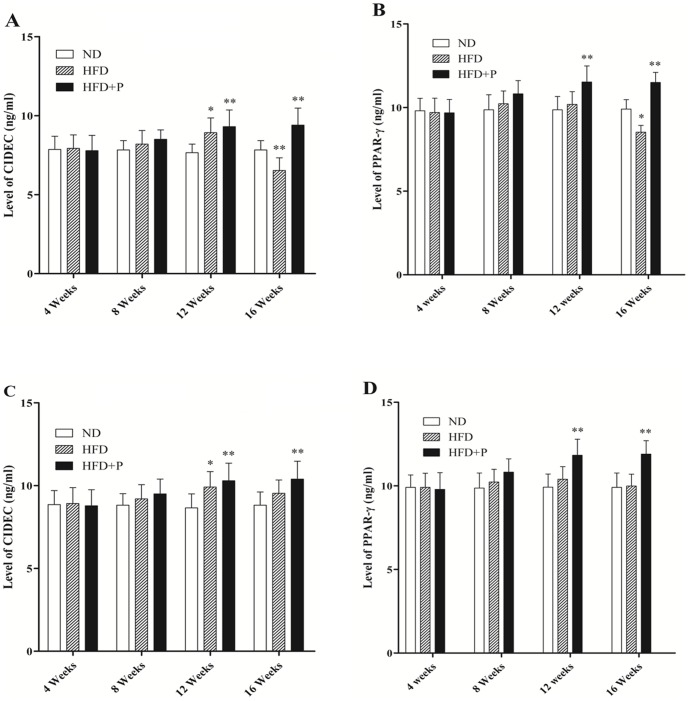
Figure 6. Effect of pioglitazone on level of CIDEC and PPAR-γ in VAT and SAT of mice, during different phases of obesity.
Five mice from each group were sacrificed and fat tissues were collected at 4, 8, 12 and 16 weeks to evaluate the protein level of CIDEC and PPAR-γ by ELISA. Level of CIDEC in VAT (A). Level of PPAR-γ in VAT (B). Level of CIDEC in SAT (C). Level of PPAR-γ in SAT (D). Data was expressed as Mean±SD. *P<0.05, **P<0.01, and ***P<0.001 represent significant difference between two groups.

