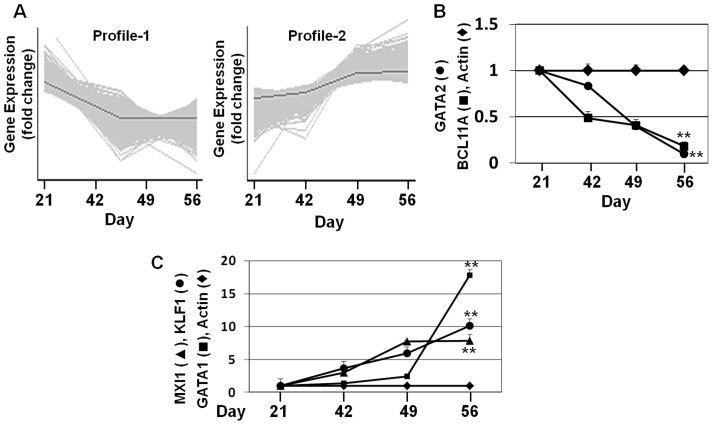
Figure 3. PCA defines major gene profiles during erythropoiesis.
A) PCA was performed for gene subsets with >1.5-fold change in expression from day 21 to day 56. The results are shown for the two major gene profiles generated by PCA. The gray line represents the mean value of time course changes in gene expression. B) Microarray data for two known γ-globin regulators were confirmed by RT-qPCR. C) Microarray data for three Profile-2 genes were confirmed by RT-qPCR.

