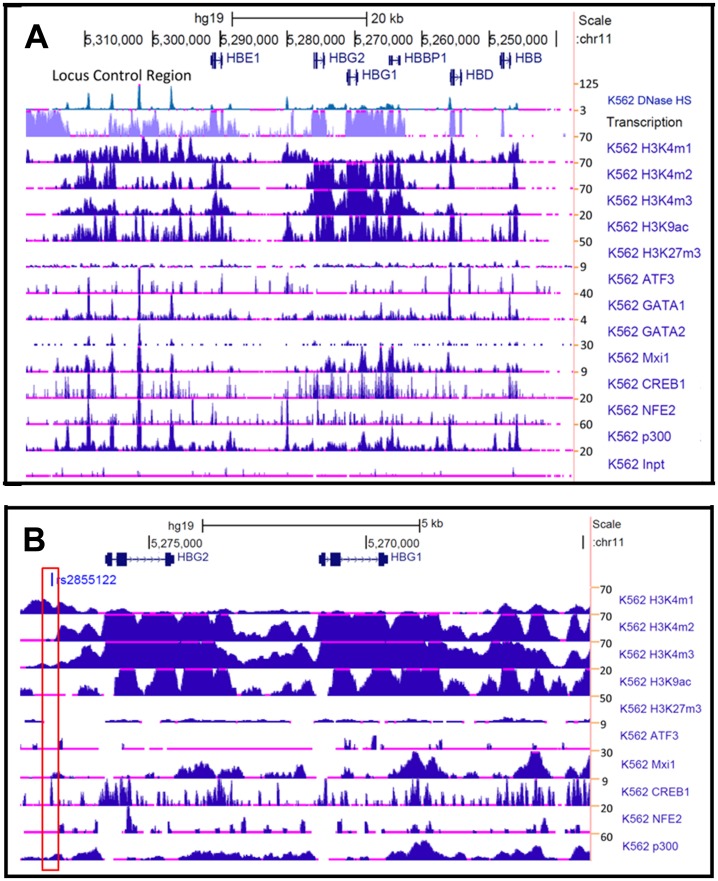
Figure 6. Data from the ENCODE project supports in vivo interaction of TFs.
A) Shown are RNA-seq and ChIP-seq data for the β-locus (5,237,658 to 5,318,750) generated by the ENCODE consortium using K562 cells. Genes are indicated with arrows showing the direction of transcription. The numbers on the right side represents the maximum z-scores which correlate with signal strength. At the bottom of the panel, “K562 Inpt” refers to input chromatin incubated with negative control antibody. B) Shown are ChIP-seq and RNA-seq data for the HBG genes (5,264,860 to 5,277,966). The red box indicates the position for the cAMP responsive element at position -1222 relative to the HBG2 gene transcription start site.

