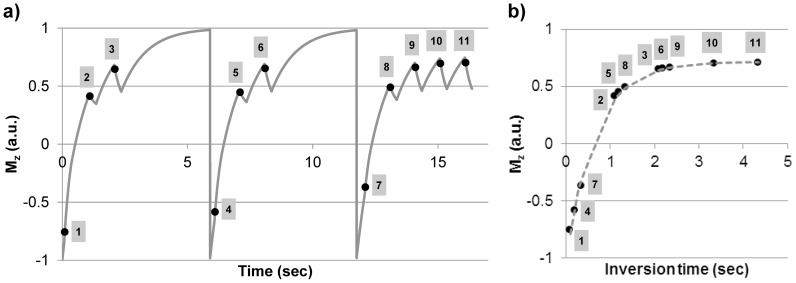
Figure 1. MOLLI acquisition and data fitting: a) Simulated longitudinal magnetization during MOLLI acquisition (T1 = 1000 ms, T2 = 30 ms, readout flip angle = 30°, echo train length = 64, heart rate = 60 bpm).
Note the complex pattern of the underlying magnetization evolution due to mixed periods of bSSFP readout and free relaxation. MOLLI data are sampled at 11 inversion times marked; b) Conventional MOLLI fitting approximates the rearranged MOLLI data with a mono-exponential function to derive an apparent T1, which is then corrected according to Eq.1.

