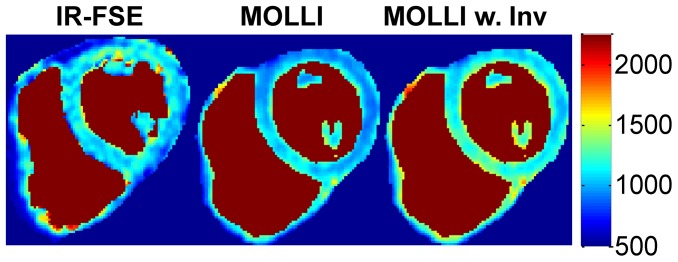
Figure 4. Example of myocardial T1 maps (in ms) obtained with IR-FSE, conventional MOLLI fitting and MOLLI fitting with inversion correction at a 30° flip angle.

The IR-FSE image was taken in a separate breath-hold than the MOLLI and therefore it is at a slightly different position. Blood has been segmented out to minimize distraction due to the blood T1: IR-FSE spoils the blood signal and is not able to fit for blood T1, however MOLLI is able to fit for T1 in the blood.
