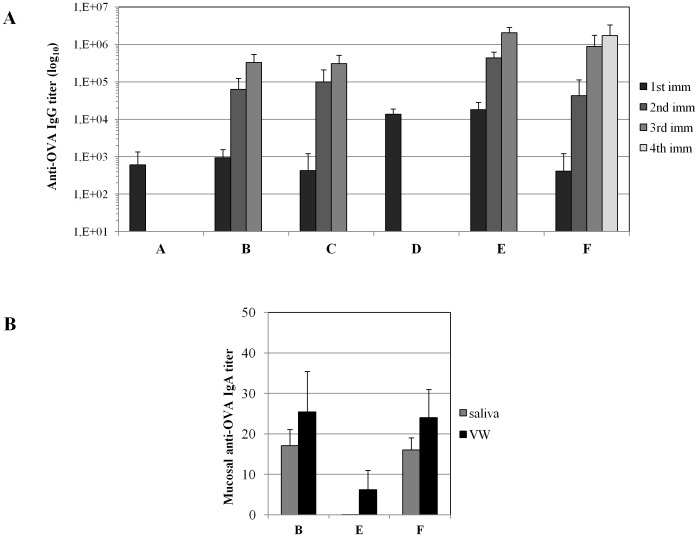
Figure 4. Analysis of antigen-specific antibodies in plasma and mucosal secretions.
(A) Kinetics of plasma anti-OVA IgG titers in mice belonging to different groups (vaccination regimens are described in Table 1) at 2 weeks after each immunization. Results are expressed as mean titer presented as group means ± standard deviations. The statistical analysis is described and discussed in the text. (B) Analysis of anti-OVA IgA titer in saliva and vaginal washes (VWs) collected 2 weeks after the final immunization. Results are expressed as mean titer presented as group means ± standard deviations.

