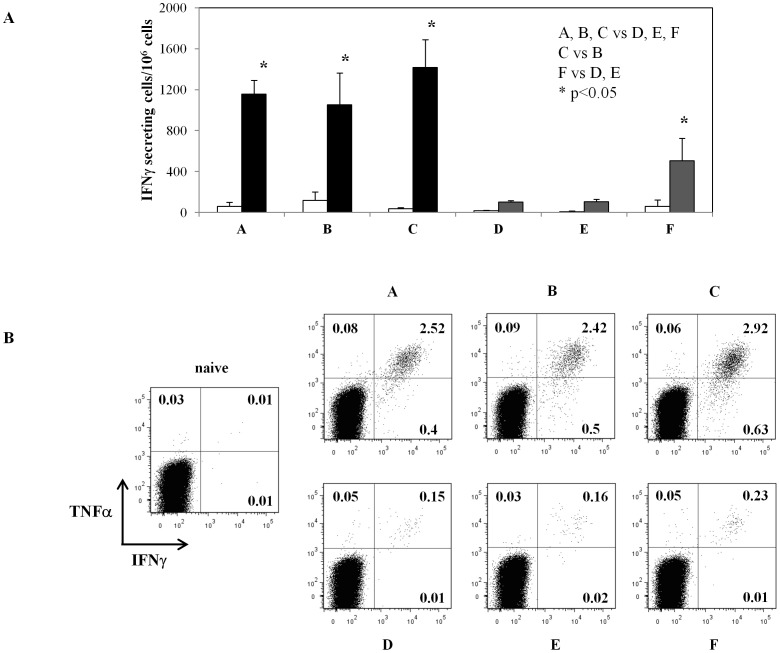
Figure 5. Persistence of systemic antigen-specific CD8+ T cell response.
Six months after the last immunization mice from all groups (vaccination regimens are described in Table 1) were sacrificed and splenocytes used for the analysis of OVA-specific T cells. (A) IFNγ ELISPOT. Splenocytes were stimulated overnight with medium alone (blank bars) or with H-2Kb restricted OVA-specific 8mer peptide (SIINFEKL) (filled bars). IFNγ-producing T cells are expressed as the number of spot forming cells per 106 cells. Results are presented as group means ± standard deviations. The asterisks indicate statistically significant differences (p<0.05) between indicated groups. (B) Analysis of multifunctional antigen-specific CD8+ T lymphocytes by intracellular assay for IFNγ and TNFα production. A representative experiment is shown. The analysis was performed on gated CD3+CD8+ cells from immunized or naïve mice. The percentages of single or double-cytokine producing cells were calculated and are indicated within the dot plots.

