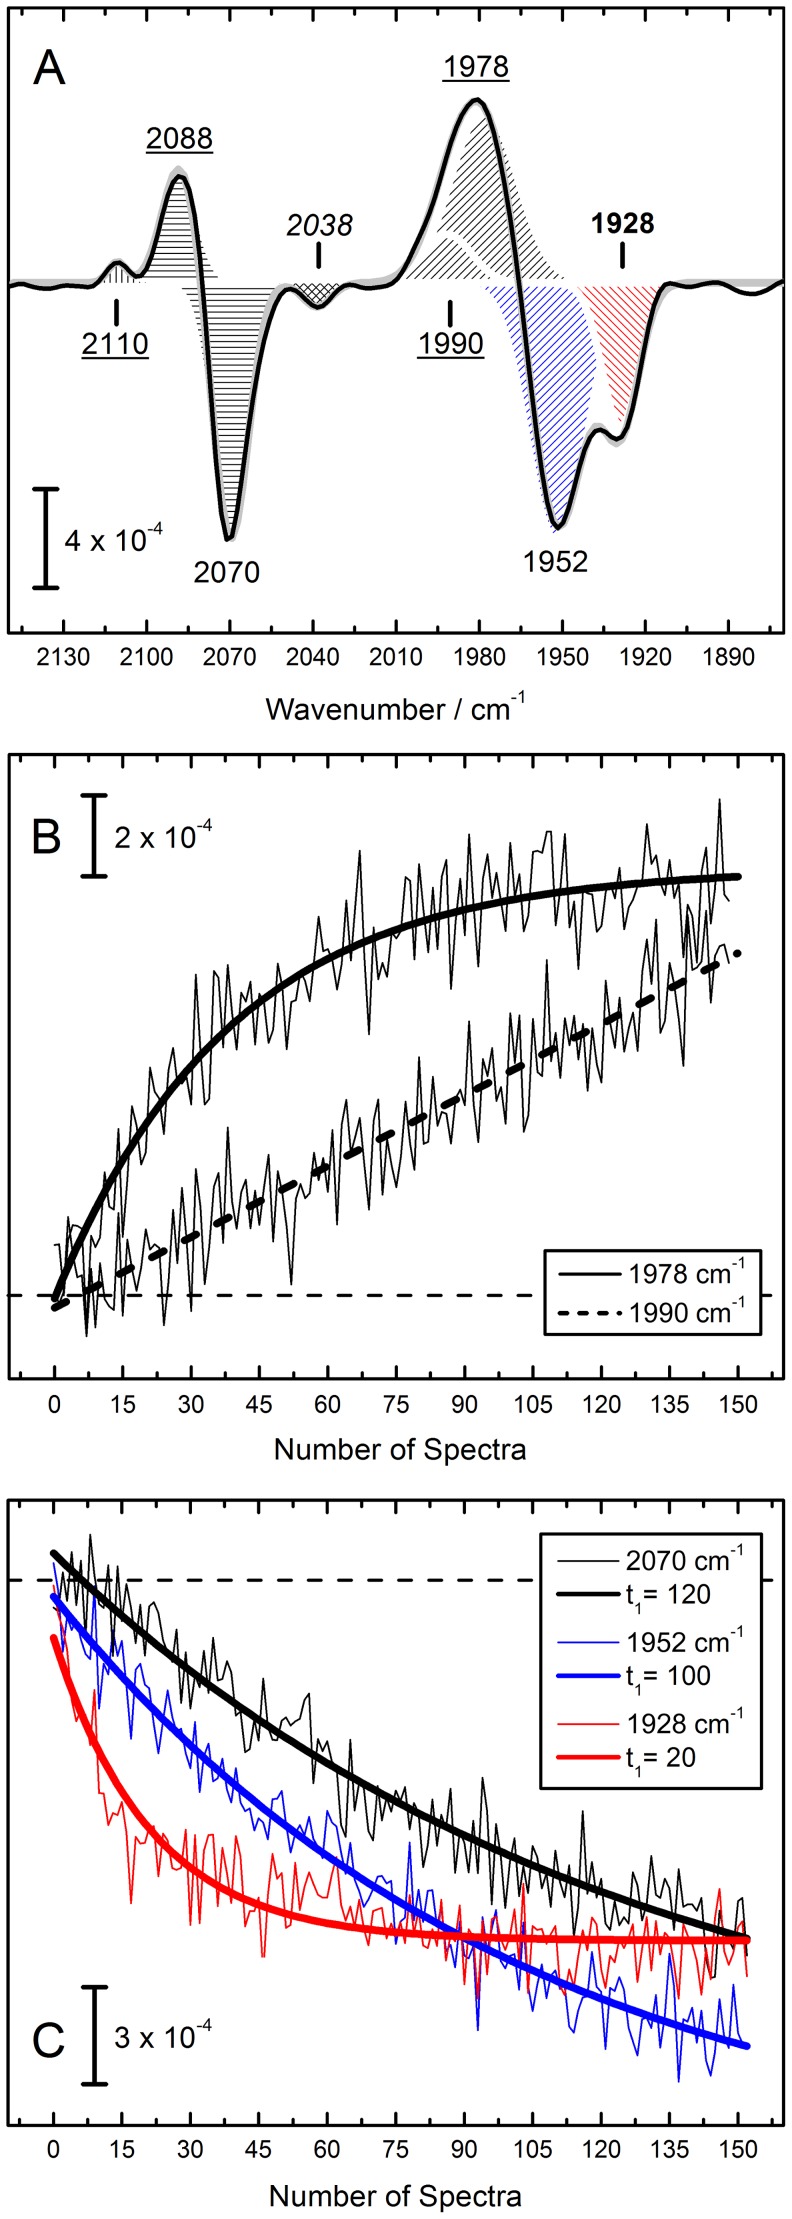
Figure 3. H2O2 IR difference spectrum of HypCDMC.
(Fig. 3A) Negative features represent the as–isolated state (1928 and 1952 cm−1 for CO in red and blue hatch, respectively, and 2070 cm−1 for CN−), positive features are attributed to the oxidized, instable Fe(III)–(CN)2CO state with 1978/1992 cm−1 attributable to CO and 2088 and 2110 cm−1 attributable to the CN− ligands [24]. A new band arises at 2038 cm−1 (cross hatch). (Fig. 3B) While the contribution at 1978 cm−1 exponentially increases after contact of the sample with H2O2, the band at 1990 cm−1 obeys a rather linear kinetic behavior. (Fig. 3C) The previously identified contributions at 1952 and 2070 cm−1 vanish simultaneously [24], however, the peak at 1928 cm−1 showcases a four to five times faster absorption decay. All kinetics are plotted in ‘Number of Spectra’ to avoid misinterpretation of temporal information.

