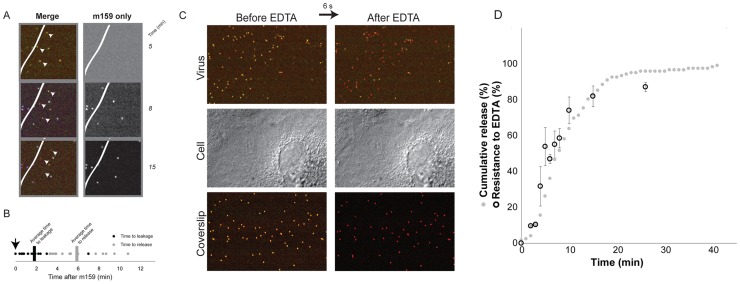
Figure 4. Internalization.
A. Image of three particles that uncoat after addition of fluorescently labeled m159 antibody to the medium. (Virus pre-bound to cells, excess medium withdrawn, and antibody-containing medium then added.) Particles that uncoat do not bind antibody. White line represents edge of cell; particles on the coverslip all bind antibody. B. Time to initiation of uncoating (decrease in VP7 and VP4 label intensities) of particles that do not bind antibody m159. The antibody was added 5–7 minutes after addition of virus to cells, as indicated by the arrow; images were collected every 6 seconds. C. EDTA pulse. Top panel: doubly labeled virus bound to cell, before and after EDTA pulse. Middle panel: DIC images of the same cell; Bottom panel: particles bound to coverslip. D. Percent of virus resistant to EDTA uncoating, as a function of time between addition of virus and pulse of EDTA (black open circles) and cumulative representation of data in 2B (gray solid circles).

