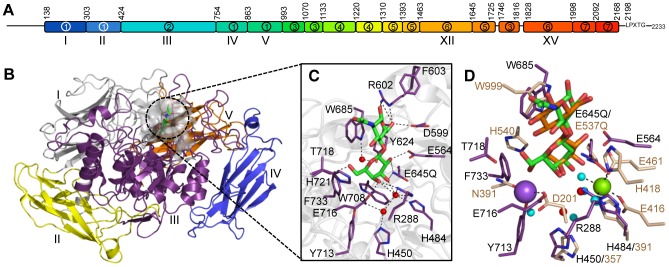
Figure 1. The structural features of BgaA from S. pneumoniae.

(A) The architecture of BgaA showing the 17 modules/domains defined on the basis of fold recognition using the Phyre2 server [39]. The 7 different modules/domains are labeled with Arabic numbers: 1, sequence similarity to GH2-associated Ig-like; 2, sequence similarity to GH2 (β/α)8-barrel; 3, fold similarity to PDB ID 2LY7 (>98% confidence); 4, fold similarity to a fragment of a bacterial invasin (95% confidence); 5, fold similarity to bacterial Ig-like modules (98% confidence); 6, predicted β-sandwich fold similar to that of family 32 CBMs (99.5% confidence); 7, fold similarity to pneumococcal G5 modules (>98% confidence). The LPXTG cell wall anchoring motif is shown. The modules/domains that are the focus of this study are labeled beneath the schematic with Roman numerals. Amino acid numbering for the module/domain boundaries is given above the schematic. (B) Cartoon representation of the structure of the catalytic region comprising domains I–V (colored sequentially as gray, yellow, purple, blue, and orange). The bound LacNAc molecule is shown as green sticks and the surface of the active site in transparent gray. (C) Specific interactions of the BgaA active site with LacNAc (green). Water molecules are shown as red spheres and hydrogen bonds as dashed lines. (D) Overlap of the BgaA active site (purple stick representation for side chains, green sticks for LacNAc, and red spheres for waters) with the active site of E. coli LacZ in complex with lactose (tan stick representation for side chains, orange sticks for lactose, and blue spheres for waters, green sphere for Mg2+, and purple sphere for Na+; PDB ID 1JYN).
