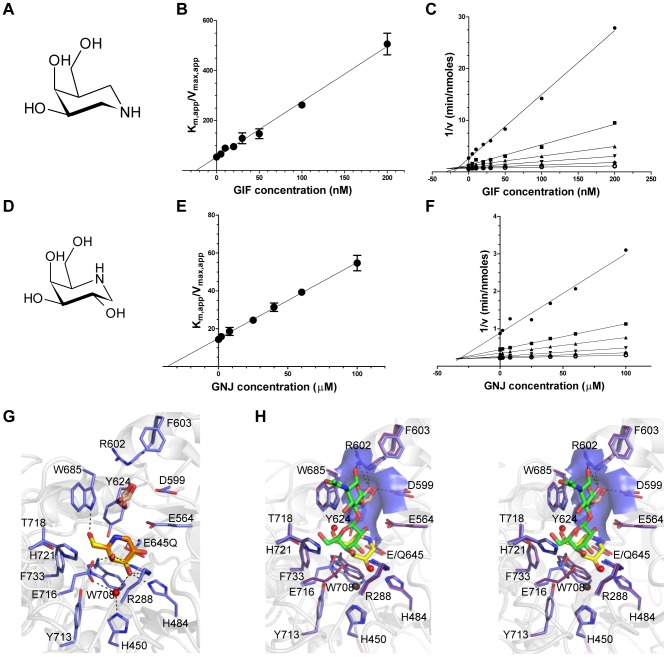
Figure 2. Characterization of BgaA inhibitors.
(A) and (D) The chemical structures of GIF and GNJ, respectively. (B) and (E) Plots of the apparent Km against GIF and GNJ concentration, respectively. Solid lines represent the best fits from linear regression analysis. (C) and (F) Dixon plots of the data shown in panels (B) and (E) for GIF and GNJ, respectively. (G) Specific interactions of the BgaA active site with GIF (yellow sticks) and GNJ (orange sticks) with the protein from the GIF complex shown. Water molecules are shown as red spheres, ethylene glycol molecules as brown sticks, and hydrogen bonds as dashed lines. (H) Divergent stereo view of an overlap of the BgaA LacNAc complex (purple stick representation for side chains, green sticks for LacNAc, and red spheres for waters) with the BgaA GIF complex (blue stick representation for side chains, yellow sticks for LacNAc, brown sticks for a bound ethylene glycol, and black spheres for waters). The surface of the pocket accommodating the O6 of the GlcNAc residue is shown as transparent blue.

