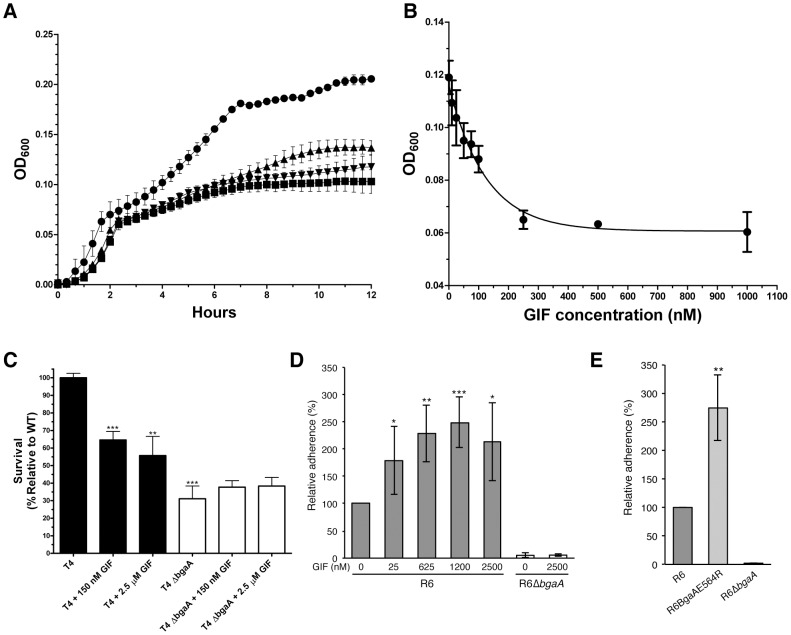
Figure 3. Inhibition of S. pneumoniae BgaA.
(A) Growth curves of S. pneumoniae (TIGR4) performed using a semi-defined medium supplemented with bovine asialofetuin. Circles represent growth of the TIGR4 strain, triangles the growth of TIGR4 strain in the presence of 1000 nM GIF, and inverted triangles the growth of the ΔbgaA strain. Also shown as squares is the growth of the TIGR4 strain in the absence of a carbon source. Error bars represent the standard deviation of triplicate experiments run in parallel. The experiment was performed three times with highly similar results. (B) Inhibition of growth on asialofetuin as a function of GIF concentration. Results represent the mean measurements of three independent experiments where culture densities were taken at 6 hr of culture growth. The error bars represent the standard deviations of the independent measurements. (C) Survival of S. pneumoniae TIGR4 in neutrophil killing assays, showing comparisons of wild-type (filled bars) and ΔbgaA strain (open bars) in the presence and absence of GIF. Asterisks above sample bars represent statistical comparison of that sample with the reference, which is the TIGR4 strain with no inhibitor. Data are mean values compiled from two independent experiments performed in duplicate ± standard deviation. The ΔbgaA samples with inhibitors were compared with ΔbgaA in the absence of inhibitors and were found to have p values>0.1 and thus were not significantly different. (D) Addition of GIF (25–2500 nM) significantly increases adherence of S. pneumoniae R6 to D562 cells. Data are the mean ± SD of four independent experiments performed in triplicate. Asterisks above sample bars represent statistical comparison of R6 and R6 + GIF. (E) Adherence of an S. pneumoniae strain expressing enzymatically inactive BgaA (R6BgaAE564R) to D562 cells is significantly higher than the adherence of parental strain (R6). Data are the mean ± SD of three independent experiments performed in triplicate. Asterisks above sample bars represent statistical comparison between R6 and R6BgaAE564R. Statistically significant differences were assessed using a two-tailed Student's t-tests. * p≤0.05, ** p≤0.007, *** p≤0.0007.

