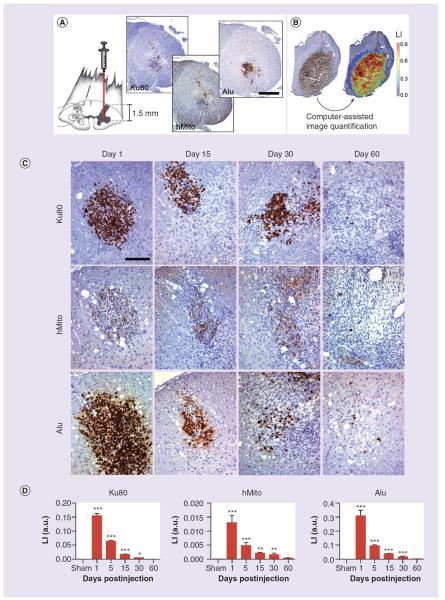
Figure 3. Human neural precursor cells are injected into the rat spinal cord, targeting the ventral horn (facing page).
(A) At 1-day postinjection, Ku80, hMito and Alu immunostainings help visualize the injection site. (B) Computer-assisted image analysis allows to make the difference between the blue staining from hematoxylin counterstaining and the di-amino-benzidine brown precipitates from specific anti-human immunohistochemistry. Hence, LI corresponding to the percentage of the immunostained tissue surface was calculated. (C) Using anti-human Ku80, hMito and Alu immunohistochemistry, neural precursor cell-derived human cells are visualized in the spinal tissue from 1 day to 60 days post-transplantation. (D) Around the injection site, we detect inflammatory reaction and gliosis, most likely causing a loss of engrafted human cells over time. This is confirmed by image quantification showing a progressive decrease of the LI of Ku80, Alu and hMito immunostainings. Scale bars represent 500 μm in (A) and 100 μm in (C). Results are expressed as mean ± standard error of the mean. *p < 0.05, **p < 0.01, ***p < 0.001 for comparisons 1, 5, 15, 30 and 60 days versus sham group.
The number of animals was, respectively, 8, 3, 5, 7, 14 and 5 rats for the experimental conditions: sham, 1, 5, 15, 30 and 60 days.
hMito: Human mitochondria; LI: Labeling index.

