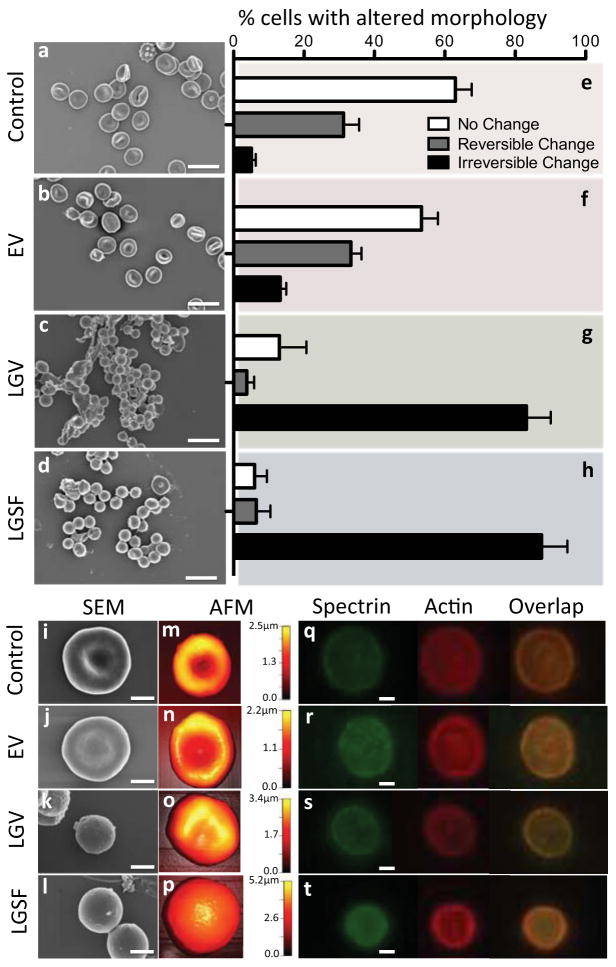
Figure 2. Assessment of RBC morphology following ectoine-based vitrification and rewarming.
a–d, Scanning electron micrographs (SEMs) of RBCs (a) Selected directly from blood, recovered after (b) ectoine-based vitrification (EV), (c) low glycerol vitrification (LGV), and (d) low glycerol slow freezing (LGSF). e–h, The percentage (%) of RBCs within a population representing (e) untreated fresh blood, and blood recovered from (f) EV, (g) LGV and (h) LGSF: biconcave shape, and reversible and irreversible shape changes (n, number of cells =114–309 and N, number of donors =3–9). Error bars in figures represent the standard error of the mean. i–l, Higher magnification (30,000x) of SEMs of (i) fresh RBCs and RBCs recovered after (j) EV, (k) LGV and (l) LGSF. m–p, Atomic Force Micrographs (AFM) of (m) fresh RBCs and RBCs recovered after (n) EV, (o) LGV, and (p) LGSF. q–t Fluorescence micrographs showing distribution of the spectrin-actin network in RBCs. (q) RBCs in fresh blood and RBCs recovered from (r) EV, (s) LGV, and (t) LGSF. Scale bar represents 10μm in a–d and 2μm in i–l and q–t.

