Figure 1.

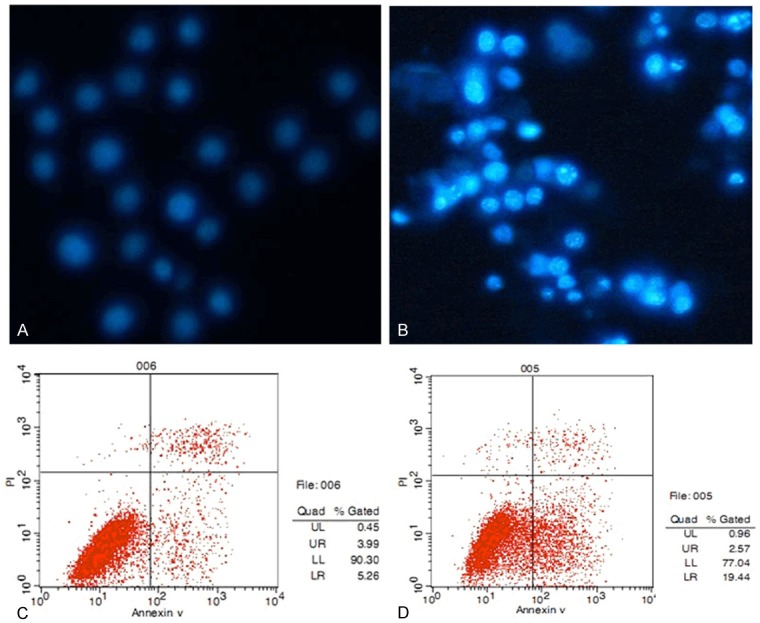
TSA induced apoptosis in SGC-7901 cells. A, B: Nuclei of most SGC-7901 cells treated with TSA were highly condensed and brightly stained; while the cells in the control group mostly appeared slightly blue. C, D: TSA treatment (75 ng/ml for 48 h) overtly induced apoptosis in SGC-7901 cells, with rates increasing from 9.25% (control group) to 22.01% (TSA group) as shown by flow cytometry.
