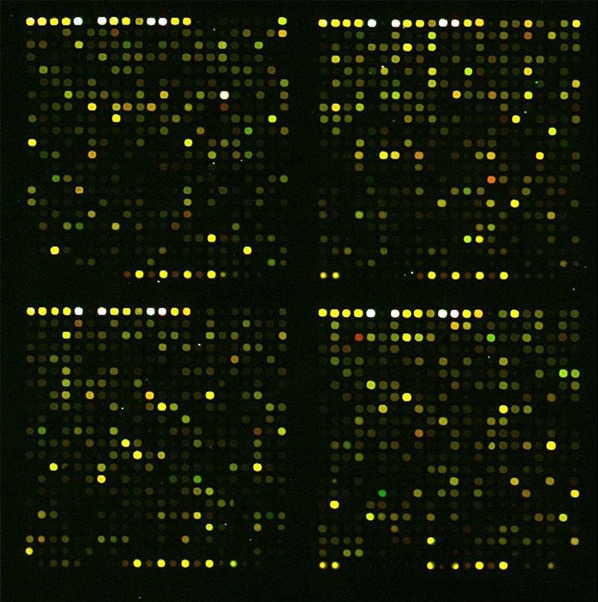
Figure 3.

Microarray hybridization pseudo color chart. Each array contained 25122 probes of which 20449 represented unique genes. The expression of 201 genes decreased in SGC-7901 cells treated with 75 ng/ml TSA for 48 hours. (red: increased expression, green: decreased expression).
