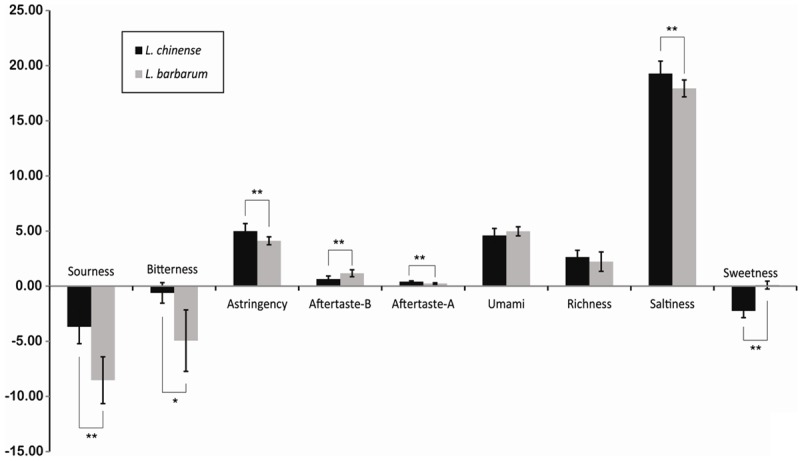
Figure 3.

Taste difference between L. chinense and L. barbarum. The bar graphs show taste respectively. Each bar represents the mean (± standard deviation) taste difference. *, P < 0.05; **, P < 0.01, and ***, P < 0.001 tasted by student t-test. Aftertaste-B is aftertaste of bitterness. Aftertaste-A is aftertaste of astringency. Richness is aftertaste of umami. The unit is taste information unit suggested by Kobayashi et al. (2010).
