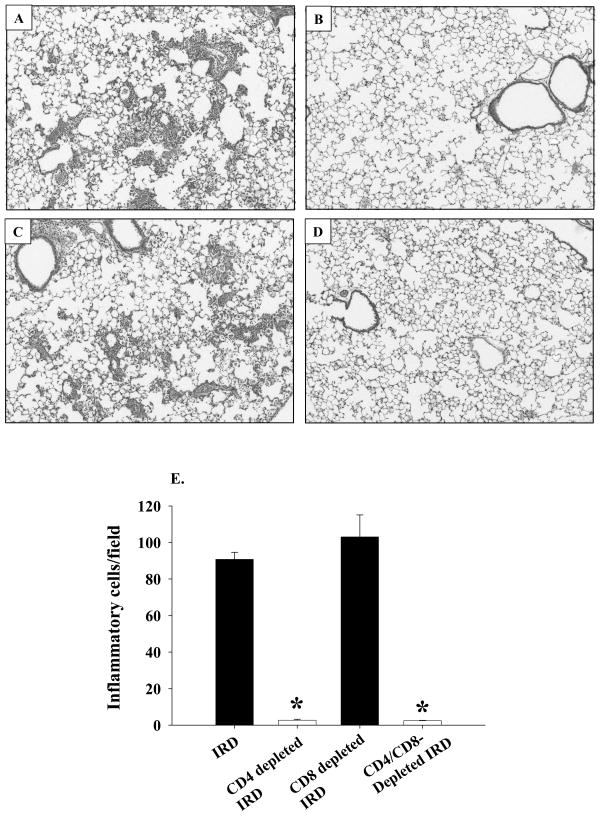
Figure 3. Histopathology of PcP in IRD mice.
At 14 days post-reconstitution lungs from non-depleted (Panel A), CD4-depleted (Panel B), CD8-depleted (Panel C), or CD4 and CD8-depleted (Panel D) IRD mice were inflation fixed with 10% buffered formalin. Four-micron sections were stained with hematoxylin and eosin and photographed at X100 magnification. The number of inflammatory cells per field were determined as described in the Materials and Methods section, and are represented as a bar graph in Panel E. Bars represent arithmetic mean ± 1 SEM (*P < 0.05 as compared to non-depleted group).

