
Fig. 1.
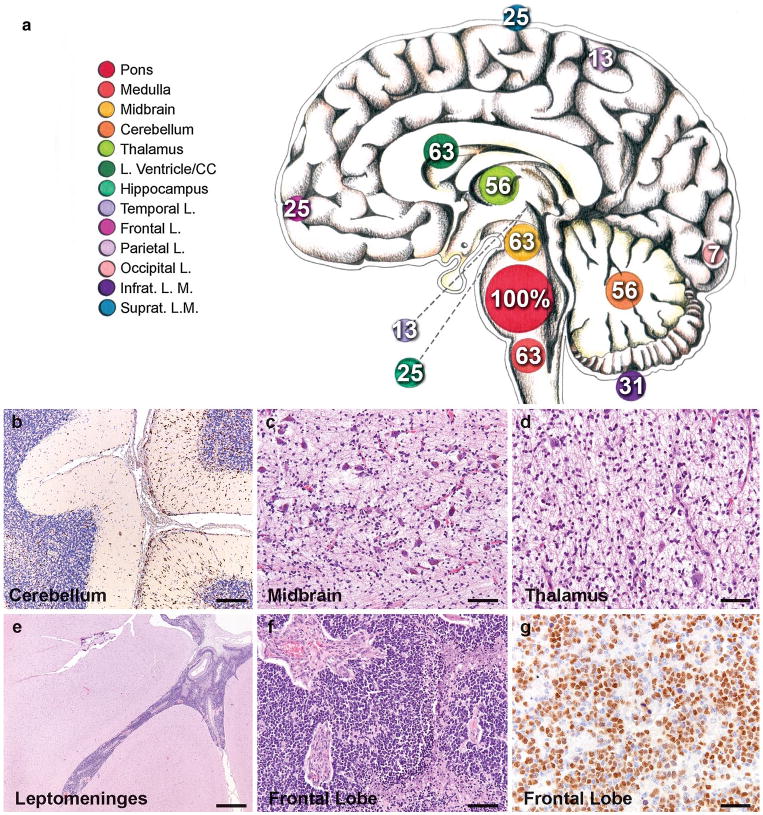
Extent of spread in DIPG. a Neuroanatomical sites and frequency of tumor invasion. Numbers indicate the percentage of cases that exhibit tumor invasion at the indicated anatomical location. The size of the circles marking each anatomical site (color key to the left) illustrates the frequency. CC corpus callosum, infrat. L.M. infratentorial leptomeninges, Suprat. L.M. supratentorial leptomeninges. photomicrographs illustrating b Olig2 + tumor cells infiltrating the cerebellum, c tumor infiltrating the substantia nigra in the midbrain (H&E), d tumor infiltrating the thalamus (H&E), e leptomeningeal spread affecting the temporal lobe (H&E), f tumor in the frontal cortex (H&E) and g Olig2 + tumor cells in the frontal lobe. Immunostains DAB with hematoxylin counterstain. Scale bars 100 μm (b–d, f), 1 mm (e) and 50 μm (g)