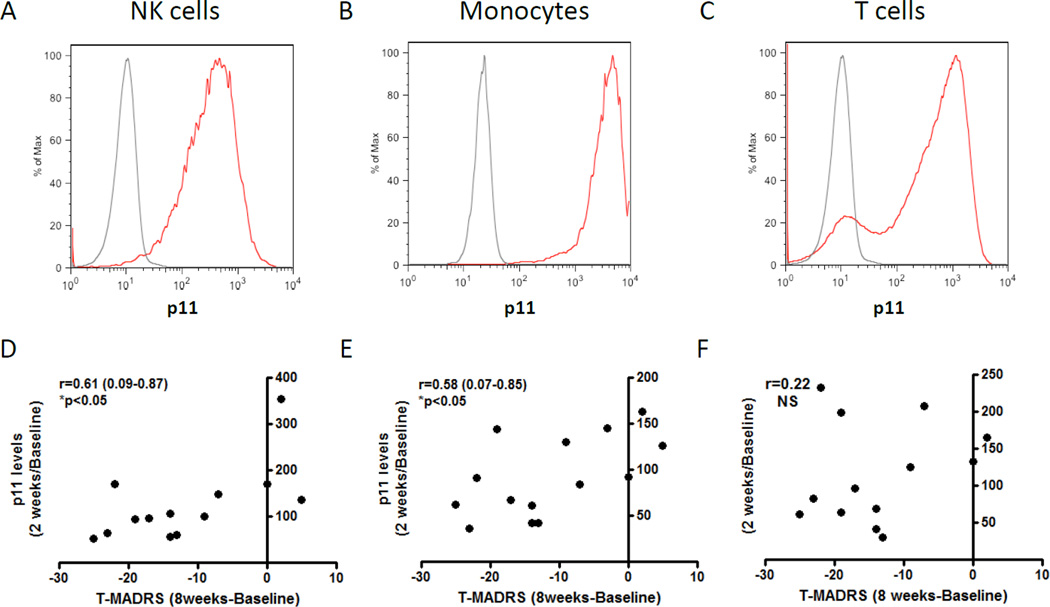
Figure 1. p11 in NK cells, monocytes, and T cells and its regulation by citalopram in depressed individuals.
Representative flow cytometry analysis of PBMCs with primary antibodies towards p11 (red lines) or IgG1 isotype control (grey lines) demonstrates specific p11 expression in essentially all (A) CD56+CD3− NK cells and all (B) CD14+monocytes and in most (C) CD3+ T cells. (D–F) Graphs showing median fluorescence intensity of p11 (percentage of baseline values) in (D) NK cells, (E) monocytes, and (F) T cells after two weeks of citalopram treatment and correlations to improvements in total MADRS score after eight weeks of citalopram treatment. Dots represent individual patients. Statistical analyses used Pearson’s correlation test and determined 95% confidence intervals. Statistical significance was defined as P<0.05.

