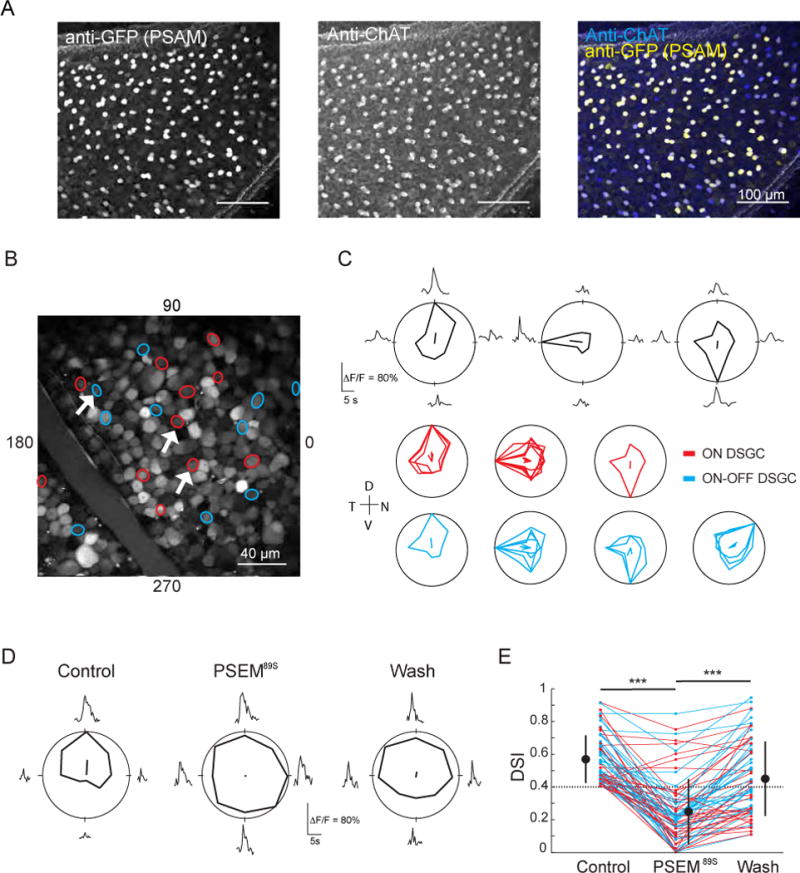
Figure 1. Reversible Inactivation of SACs Abolishes Direction Selectivity.

(A) Fluorescence projections of confocal images of the ganglion cell layer of a ChAT-Cre mouse retina injected with AAV2-PSAML141F,Y115F-GlyR-IRES-GFP. Immunostain is for GFP (co-expresses with PSAM, left) and choline acetyltransferase (ChAT), a marker for SACs (middle). GFP-positive cells are also ChAT immunoreactive (right).
(B) Two-photon fluorescence image of the ganglion cell layer of a retina expressing PSAM that has been electroporated with cell impermeant Oregon Green 488 BAPTA-1. Circles are cells identified as DSGCs, color-coded by response type (red: On DSGCs, blue: On-Off DSGCs). White arrows correspond to the individual tuning curves in (C).
(C) Top: examples of average calcium responses (ΔF/F0) and tuning curves of three DSGCs (white arrows in (B)) in response to a UV bar moving in eight different directions. The solid lines inside the polar plots indicate the vector-summed response corresponding to the preferred direction. Bottom: tuning curves for all of the DSGCs imaged in (B). Each tuning curve is normalized to the maximum response for each cell. Color codes as in (B). Axes of the retina are indicated to the left of the plots; D = dorsal, N = nasal, T = temporal, V = ventral.
(D) Example tuning curve of a DSGC before (Control), during (PSEM89S) and after (Wash) the addition of PSEM89S.
(E) Effect of PSEM89S on the direction selective index (DSI) of DSGCs (n = 68 cells) in 5 retinas. Large circles are group means, error bars are SD, dotted line indicates the threshold DSI for defining a cell as a DSGC (DSI > 0.4). Color codes as in (B).
*** indicates p<0.001, Tukey post-hoc test.
See also Figure S1.
