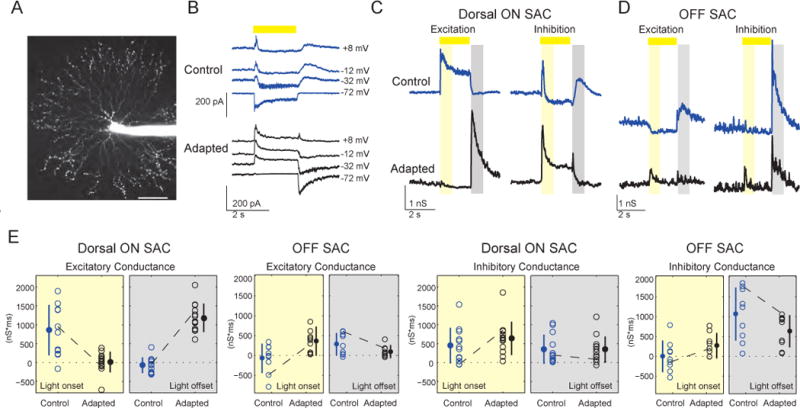
Figure 2. SACs Switch Their Polarity as AResult of Visual Stimulation.

Blue data = controls (before adaptation), black data = adapted cells. Light stimulation is indicated by the yellow bar.
(A) Projection of fluorescence image of an Off-SAC filled with Alexa Fluor 594, scale: 50 μm.
(B) Synaptic currents onto a dorsal On-SAC at different holding potentials in response to a 2-s light spot (225 μm diameter) before (top) and after (bottom) adaptation. Traces are averages of five sweeps.
(C, D) Excitatory and inhibitory conductances from a dorsal On-SAC (C) and an Off-SAC (D) were evaluated at 10 ms intervals based on the I–V relations in response to a 2-s white spot stimulus. The On-SAC conductances correspond to the current measurements shown in (B). The time periods for calculating the integrated conductances (see (E) below) are indicated by the yellow rectangle for light onset (50–850 ms after light onset) and by the grey rectangle for light offset (100–900 ms after light offset).
(E) The integrated excitatory and inhibitory conductances during light onset and light offset for dorsal On-SACs and all Off-SACs before and after adaptation. Empty circles are conductances in individual cells. Dashed lines represent the example cells shown in (C) and (D). Mean values are represented by the filled circles, error bars = standard deviation.
See also Figure S3.
