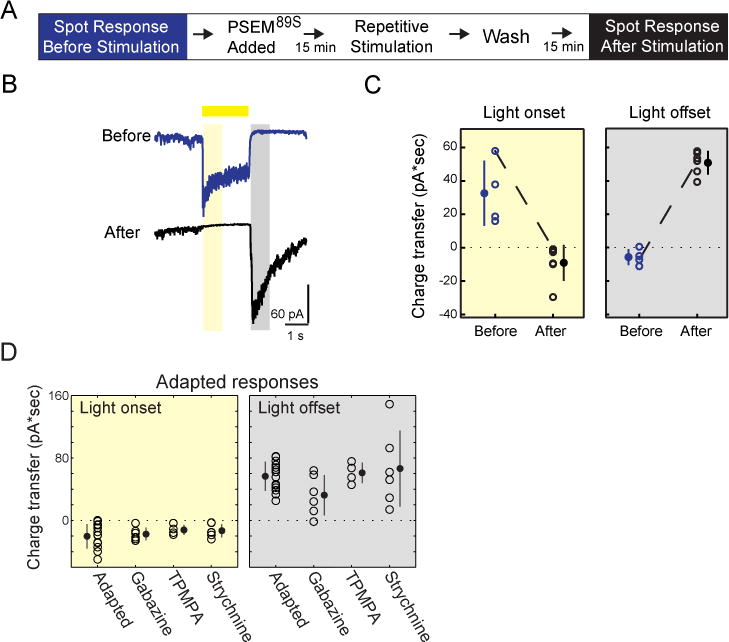
Figure 3. Polarity Switch Occurs Independent of SAC Activity and Inhibitory Circuits.

(A) Protocol for assessing SAC adaptation in the presence of PSEM89S. PSEM89S was present during the repetitive stimulation but not while measuring the response to light spot stimuli before and after stimulation.
(B) Example of voltage clamp recording (average of 5 sweeps) from PSAM-expressing On-SAC held at −72 mV during light spot stimuli presented before and after the protocol outlined in (A). The time periods for calculating the charge transfer are indicated by the yellow rectangle for light onset (50–850 ms after light onset) and by the grey rectangle for light offset (100–900 ms after light offset).
(C) Charge transfer (averaged over five sweeps) of the excitatory current during light onset and light offset as specified by the yellow and grey boxes in (B) for On-SACs before and after stimulation in the presence of PSEM89S. The dotted line is the cell in (B).
(D) The excitatory charge transfer during light onset (yellow) and light offset (grey) in individual adapted On-SACs in control solution (Adapted) and after application of 5 μM gabazine, 50 μM TPMPA, or 1 M strychnine. For (C, D) Empty circles = individual cells, solid circles = mean, error bars = SD.
See also Figure S2.
