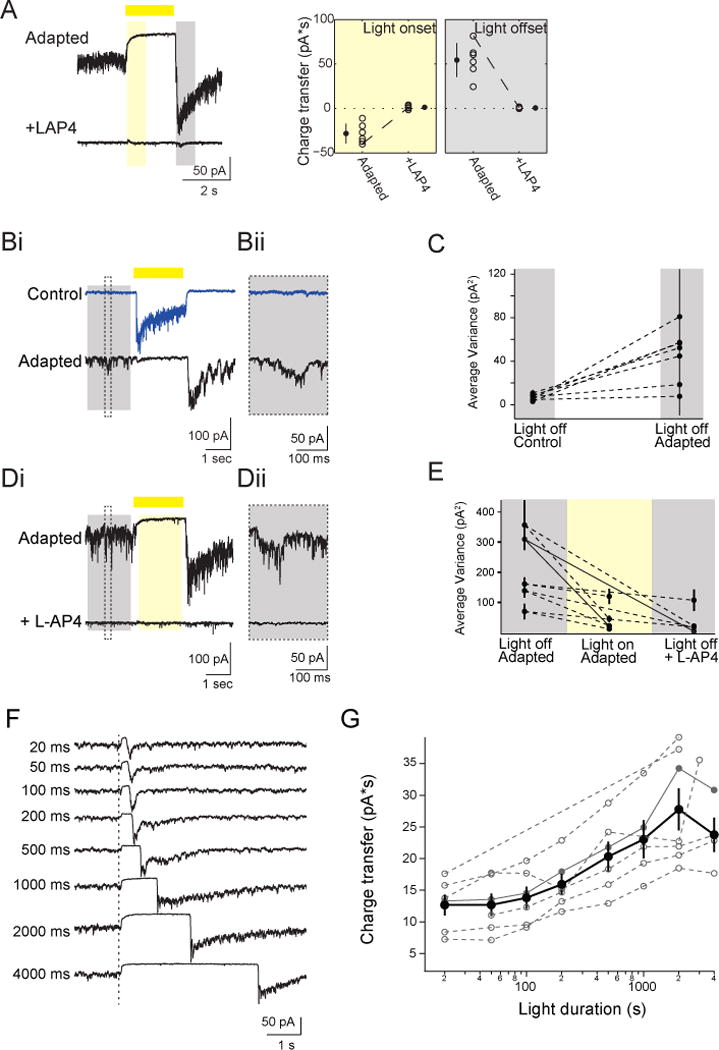
Figure 5. On-cone BCs Mediate Polarity Switch in SACs.

(A) Left: Excitatory current in adapted On-SACs in control solution (top) and after application of 5 μM L-AP4 (bottom) (holding potential = −72 mV). Conventions are as in Figure 3B. Right: The excitatory charge transfer at light onset and light offset for adapted On-SACs in control solution and in L-AP4. Conventions are as in Figure 3C. (Bi) Individual voltage clamp sweeps at −72 mV holding potential showing the excitatory current during presentation of a 2 s light flash (yellow bar) in an On-SAC before and after repetitive stimulation. The time period used to measure the variance in the holding current quantified in (C) is represented by the grey box. Dotted line indicates the inset in (Bii) showing the spontaneous activity.
(C) The variance of the excitatory current of On-SACs (n = 6 cells) during the 1800 ms “light off” period (grey box in (Bi)). For each cell, the average of the variance from 5 sweeps is plotted (black dots) with the standard deviation.
(Di) Individual voltage clamp sweeps at −72 mV holding potential showing the excitatory current in an adapted On-SAC during presentation of a 2 s light flash (yellow bar) in control solution (above) and after adding 5 μM L-AP4 (below). Dotted box is the timing of the inset in (Dii) showing the spontaneous activity, the grey rectangle is the time period used for “Light off” analysis in (E) and yellow rectangle is the time period used for “Light on” analysis in (E).
(E) The variance of the excitatory current in adapted On-SACs (n = 5 cells) during 1800 ms “light off” and “light on” periods (grey and yellow rectangles in Di, respectably). For each cell, the average of the variance from 5 sweeps is plotted (black dots) with the standard deviation. Solid lines represent the variance for the example cell in (D).
(F) Voltage clamp recordings (holding potential = −72 mV) from an On-SAC. Dotted line is the time of light onset. Duration of the light flash is indicated by the time to the left of traces. Traces are averages of five sweeps.
(G) Excitatory charge transfer during the 400 ms following the time of the maximum current as a function of light flash duration plotted on a semi-log scale. Open grey circles = individual cells. Closed grey circles = example cell shown in (F). Black circles = average across cells. Error bars = SEM.
See also Figure S4.
