. 2014 Jul 9;6(5):434–443. doi: 10.4168/aair.2014.6.5.434
Copyright © 2014 The Korean Academy of Asthma, Allergy and Clinical Immunology • The Korean Academy of Pediatric Allergy and Respiratory Disease
This is an Open Access article distributed under the terms of the Creative Commons Attribution Non-Commercial License (http://creativecommons.org/licenses/by-nc/3.0/) which permits unrestricted non-commercial use, distribution, and reproduction in any medium, provided the original work is properly cited.
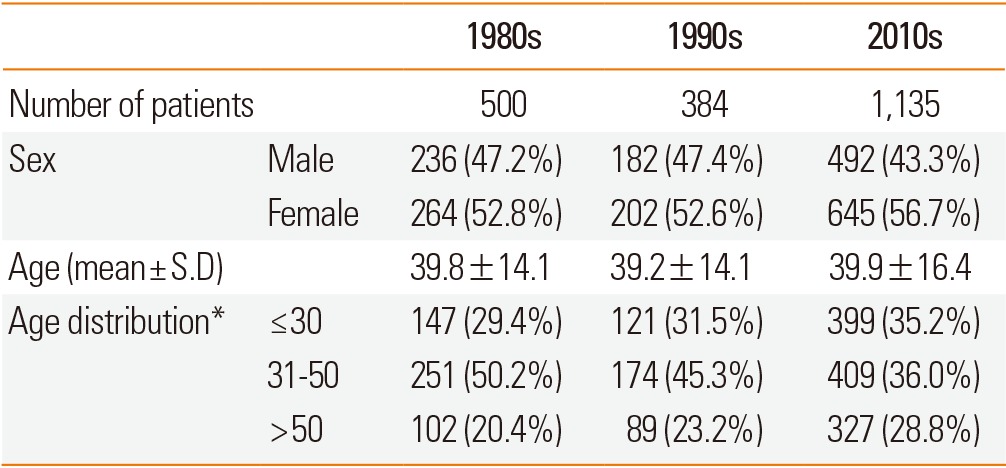
Table 2.
Age and sex distribution

*P<00.05.
S.D, Standard Deviation.
