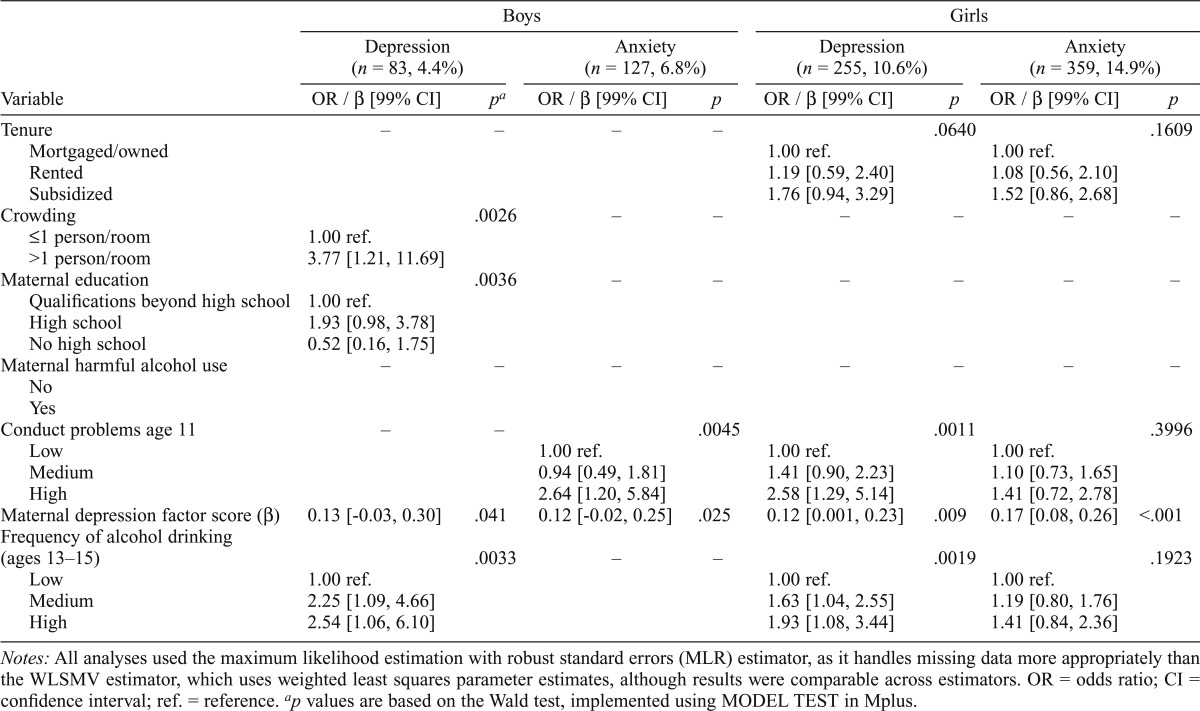
Table 3.
Multivariable model results

| Boys |
Girls |
|||||||
| Depression (n = 83, 4.4%) |
Anxiety (n = 127, 6.8%) |
Depression (n = 255, 10.6%) |
Anxiety (n = 359, 14.9%) |
|||||
| Variable | OR / β [99% CI] | pa | OR / β [99% CI] | p | OR / β [99% CI] | p | OR / β [99% CI] | p |
| Tenure | – | – | – | – | .0640 | .1609 | ||
| Mortgaged/owned | 1.00 ref. | 1.00 ref. | ||||||
| Rented | 1.19 [0.59, 2.40] | 1.08 [0.56, 2.10] | ||||||
| Subsidized | 1.76 [0.94, 3.29] | 1.52 [0.86, 2.68] | ||||||
| Crowding | .0026 | – | – | – | – | – | – | |
| ≤1 person/room | 1.00 ref. | |||||||
| >1 person/room | 3.77 [1.21, 11.69] | |||||||
| Maternal education | .0036 | – | – | – | – | – | – | |
| Qualifications beyond high school | 1.00 ref. | |||||||
| High school | 1.93 [0.98, 3.78] | |||||||
| No high school | 0.52 [0.16, 1.75] | |||||||
| Maternal harmful alcohol use | – | – | – | – | – | – | – | – |
| No | ||||||||
| Yes | ||||||||
| Conduct problems age 11 | – | – | .0045 | .0011 | .3996 | |||
| Low | 1.00 ref. | 1.00 ref. | 1.00 ref. | |||||
| Medium | 0.94 [0.49, 1.81] | 1.41 [0.90, 2.23] | 1.10 [0.73, 1.65] | |||||
| High | 2.64 [1.20, 5.84] | 2.58 [1.29, 5.14] | 1.41 [0.72, 2.78] | |||||
| Maternal depression factor score (β) | 0.13 [-0.03, 0.30] | .041 | 0.12 [-0.02, 0.25] | .025 | 0.12 [0.001, 0.23] | .009 | 0.17 [0.08, 0.26] | <.001 |
| Frequency of alcohol drinking (ages 13–15) | .0033 | – | – | .0019 | .1923 | |||
| Low | 1.00 ref. | 1.00 ref. | 1.00 ref. | |||||
| Medium | 2.25 [1.09, 4.66] | 1.63 [1.04, 2.55] | 1.19 [0.80, 1.76] | |||||
| High | 2.54 [1.06, 6.10] | 1.93 [1.08, 3.44] | 1.41 [0.84, 2.36] | |||||
Notes: All analyses used the maximum likelihood estimation with robust standard errors (MLR) estimator, as it handles missing data more appropriately than the WLSMV estimator, which uses weighted least squares parameter estimates, although results were comparable across estimators. OR = odds ratio; CI = confidence interval; ref. = reference.
p values are based on the Wald test, implemented using MODEL TEST in Mplus.
