
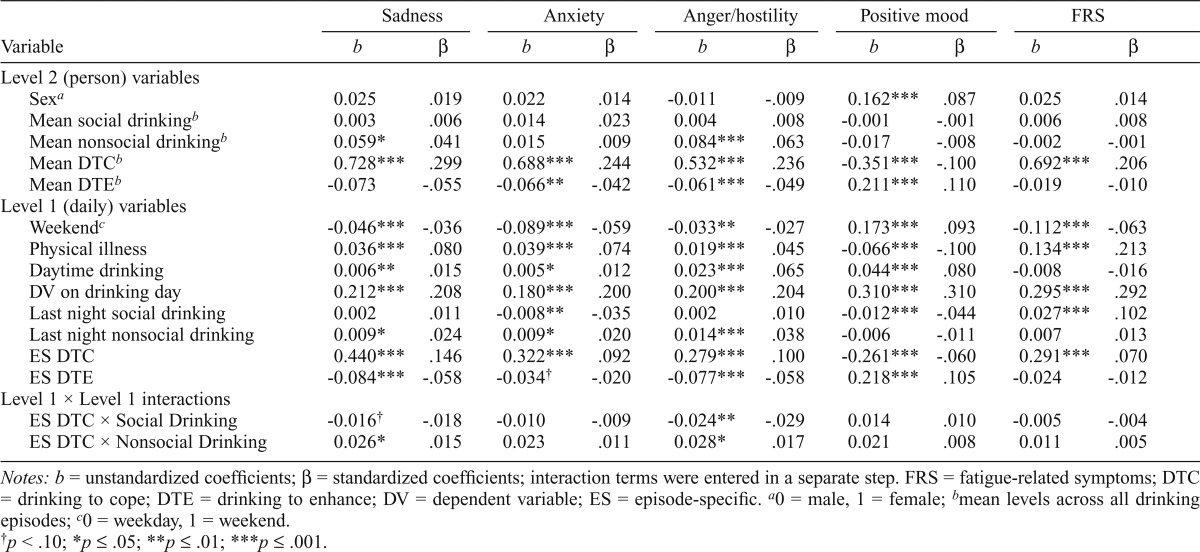
Table 1.
Multilevel regression results predicting mood and fatigue-related symptoms the day after drinking episodes
| Sadness |
Anxiety |
Anger/hostility |
Positive mood |
FRS |
||||||
| Variable | b | β | b | β | b | β | b | β | b | β |
| Level 2 (person) variables | ||||||||||
| Sexa | 0.025 | .019 | 0.022 | .014 | -0.011 | -.009 | 0.162*** | .087 | 0.025 | .014 |
| Mean social drinkingb | 0.003 | .006 | 0.014 | .023 | 0.004 | .008 | -0.001 | -.001 | 0.006 | .008 |
| Mean nonsocial drinkingb | 0.059* | .041 | 0.015 | .009 | 0.084*** | .063 | -0.017 | -.008 | -0.002 | -.001 |
| Mean DTCb | 0.728*** | .299 | 0.688*** | .244 | 0.532*** | .236 | -0.351*** | -.100 | 0.692*** | .206 |
| Mean DTEb | -0.073 | -.055 | -0.066** | -.042 | -0.061*** | -.049 | 0.211*** | .110 | -0.019 | -.010 |
| Level 1 (daily) variables | ||||||||||
| Weekendc | -0.046*** | -.036 | -0.089*** | -.059 | -0.033** | -.027 | 0.173*** | .093 | -0.112*** | -.063 |
| Physical illness | 0.036*** | .080 | 0.039*** | .074 | 0.019*** | .045 | -0.066*** | -.100 | 0.134*** | .213 |
| Daytime drinking | 0.006** | .015 | 0.005* | .012 | 0.023*** | .065 | 0.044*** | .080 | -0.008 | -.016 |
| DV on drinking day | 0.212*** | .208 | 0.180*** | .200 | 0.200*** | .204 | 0.310*** | .310 | 0.295*** | .292 |
| Last night social drinking | 0.002 | .011 | -0.008** | -.035 | 0.002 | .010 | -0.012*** | -.044 | 0.027*** | .102 |
| Last night nonsocial drinking | 0.009* | .024 | 0.009* | .020 | 0.014*** | .038 | -0.006 | -.011 | 0.007 | .013 |
| ES DTC | 0.440*** | .146 | 0.322*** | .092 | 0.279*** | .100 | -0.261*** | -.060 | 0.291*** | .070 |
| ES DTE | -0.084*** | -.058 | -0.034† | -.020 | -0.077*** | -.058 | 0.218*** | .105 | -0.024 | -.012 |
| Level 1 × Level 1 interactions | ||||||||||
| ES DTC × Social Drinking | -0.016† | -.018 | -0.010 | -.009 | -0.024** | -.029 | 0.014 | .010 | -0.005 | -.004 |
| ES DTC × Nonsocial Drinking | 0.026* | .015 | 0.023 | .011 | 0.028* | .017 | 0.021 | .008 | 0.011 | .005 |
Notes: b = unstandardized coefficients; β = standardized coefficients; interaction terms were entered in a separate step. FRS = fatigue-related symptoms; DTC = drinking to cope; DTE = drinking to enhance; DV = dependent variable; ES = episode-specific.
a
0 = male, 1 = female;
b
mean levels across all drinking episodes;
c
0 = weekday, 1 = weekend.
†
p < .10;
*
p ≤ .05;
**
p ≤ .01;
***
p ≤ .001.