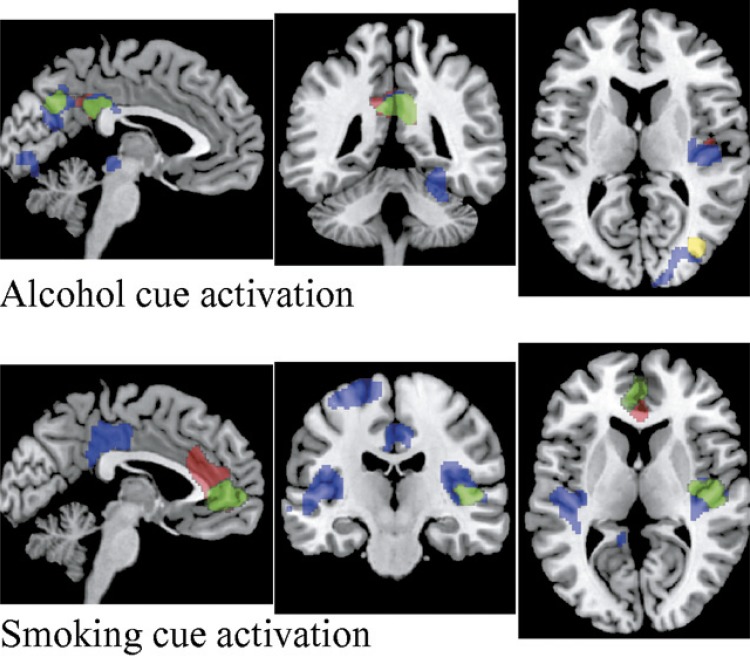
Figure 2.
Clusters with brain activation associated with behavioral assessments. Top panel: Clusters during the alcohol cues. Red regions are correlated with the Alcohol Use Disorders Identification Test (AUDIT) total score, including the posterior cingulate cortex (PCC), precuneus, and right posterior insula (rp-insula). Yellow regions are correlated with the AUDIT–alcohol consumption, including the right precuneus and middle occipital gyrus. Blue regions are correlated with the Alcohol Dependence Scale–loss of behavioral control (ADS-lbc) score, including the right fusiform gyrus, middle/posterior cingulate, precuneus, rp-insula, and superior/middle occipital gyrus. Green regions are correlated with the ICS score, including the PCC and precuneus. Bottom panel: Clusters during the smoking cues. Red regions are correlated with the Fagerström Test of Nicotine Dependence (FTND) score, including the anterior cingulate and medial frontal gyrus. Blue regions are correlated with the ADS-lbc score, including the left and right posterior insula, PCC, and left superior frontal gyrus. Green regions are correlated with the Impaired Control Scale (ICS) score, including the anterior cingulate, medial frontal gyrus, and rp-insula. When the regions overlap, only the top color is shown.

