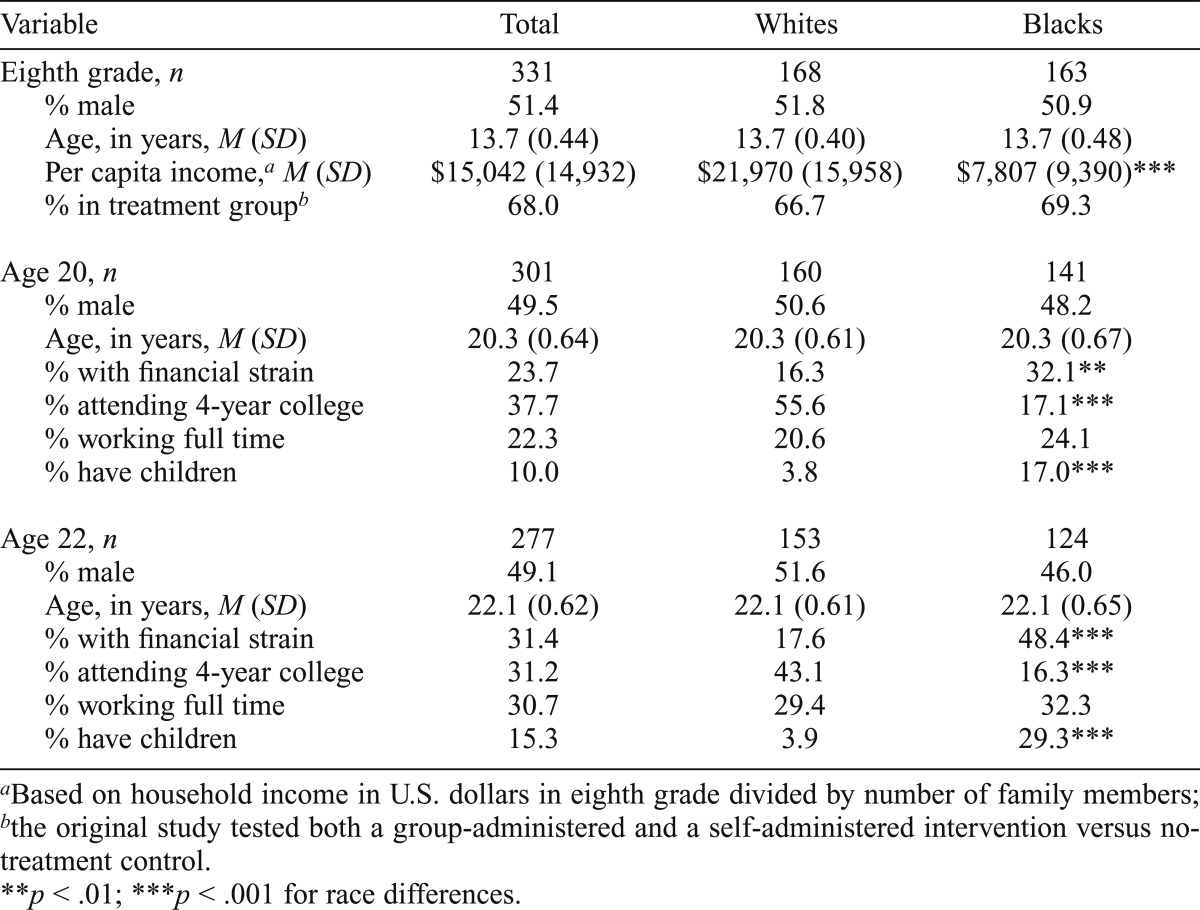
Table 1.
Sample characteristics by race

| Variable | Total | Whites | Blacks |
| Eighth grade, n | 331 | 168 | 163 |
| % male | 51.4 | 51.8 | 50.9 |
| Age, in years, M (SD) | 13.7 (0.44) | 13.7 (0.40) | 13.7 (0.48) |
| Per capita income,a M (SD) | $15,042 (14,932) | $21,970 (15,958) | $7,807 (9,390)*** |
| % in treatment groupb | 68.0 | 66.7 | 69.3 |
| Age 20, n | 301 | 160 | 141 |
| % male | 49.5 | 50.6 | 48.2 |
| Age, in years, M (SD) | 20.3 (0.64) | 20.3 (0.61) | 20.3 (0.67) |
| % with financial strain | 23.7 | 16.3 | 32.1** |
| % attending 4-year college | 37.7 | 55.6 | 17.1*** |
| % working full time | 22.3 | 20.6 | 24.1 |
| % have children | 10.0 | 3.8 | 17.0*** |
| Age 22, n | 277 | 153 | 124 |
| % male | 49.1 | 51.6 | 46.0 |
| Age, in years, M (SD) | 22.1 (0.62) | 22.1 (0.61) | 22.1 (0.65) |
| % with financial strain | 31.4 | 17.6 | 48.4*** |
| % attending 4-year college | 31.2 | 43.1 | 16.3*** |
| % working full time | 30.7 | 29.4 | 32.3 |
| % have children | 15.3 | 3.9 | 29.3*** |
Based on household income in U.S. dollars in eighth grade divided by number of family members;
the original study tested both a group-administered and a self-administered intervention versus no-treatment control.
p < .01;
p < .001 for race differences.
