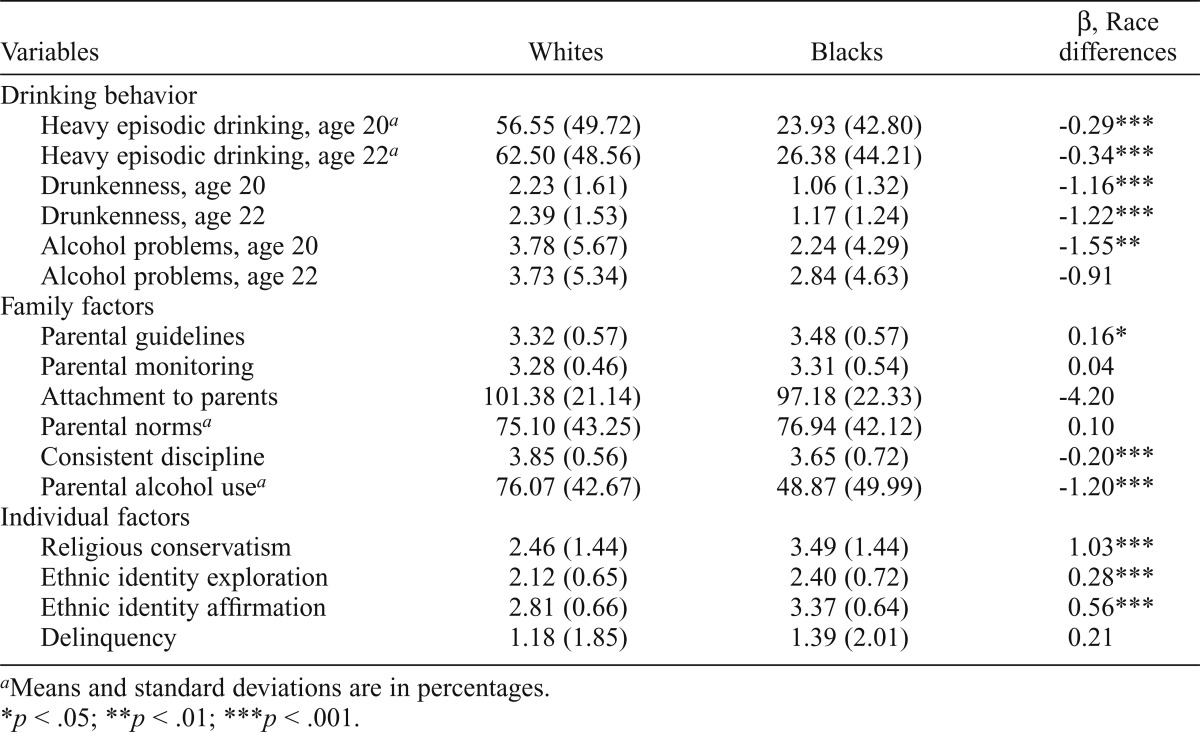
Table 2.
Means (SD) by race with tests of differences in clustering and validation variables

| Variables | Whites | Blacks | β, Race differences |
| Drinking behavior | |||
| Heavy episodic drinking, age 20a | 56.55 (49.72) | 23.93 (42.80) | -0.29*** |
| Heavy episodic drinking, age 22a | 62.50 (48.56) | 26.38 (44.21) | -0.34*** |
| Drunkenness, age 20 | 2.23 (1.61) | 1.06 (1.32) | -1.16*** |
| Drunkenness, age 22 | 2.39 (1.53) | 1.17 (1.24) | -1. 22*** |
| Alcohol problems, age 20 | 3.78 (5.67) | 2.24 (4.29) | -1.55** |
| Alcohol problems, age 22 | 3.73 (5.34) | 2.84 (4.63) | -0.91 |
| Family factors | |||
| Parental guidelines | 3.32 (0.57) | 3.48 (0.57) | 0.16* |
| Parental monitoring | 3.28 (0.46) | 3.31 (0.54) | 0.04 |
| Attachment to parents | 101.38 (21.14) | 97.18 (22.33) | -4.20 |
| Parental normsa | 75.10 (43.25) | 76.94 (42.12) | 0.10 |
| Consistent discipline | 3.85 (0.56) | 3.65 (0.72) | -0.20*** |
| Parental alcohol usea | 76.07 (42.67) | 48.87 (49.99) | -1.20*** |
| Individual factors | |||
| Religious conservatism | 2.46 (1.44) | 3.49 (1.44) | 1.03*** |
| Ethnic identity exploration | 2.12 (0.65) | 2.40 (0.72) | 0.28*** |
| Ethnic identity affirmation | 2.81 (0.66) | 3.37 (0.64) | 0.56*** |
| Delinquency | 1.18 (1.85) | 1.39 (2.01) | 0.21 |
Means and standard deviations are in percentages.
p < .05;
p < .01;
p < .001.
